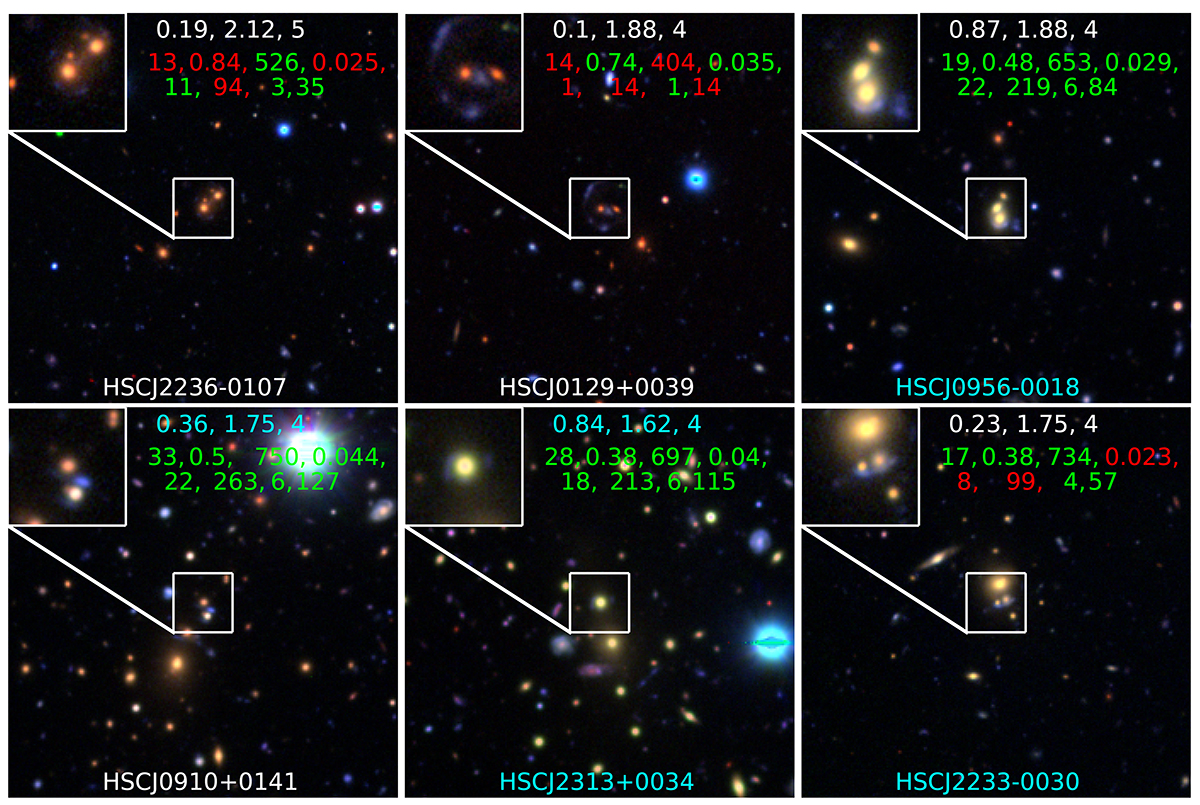
Fig. 4.

Download original image
New grade A or grade B lens candidates visually identified to be on group- or cluster-scale, excluding known group- or cluster lenses from the SuGOHI sample. Each panel is 80″ × 80″, and the insert on the top-left shows the 12″ × 12″ cutout analysed by the ResNet. The lens name is given in the bottom of each panel, in cyan if listed in the galaxy cluster catalogs, and otherwise white. Furthermore, the network score, average grade, and number of cluster votes during visual inspection is given in the top (first row), in orange if listed by C21, in cyan if listed in this work, and white if in both. This is followed by the photo-z characteristics Nmax, zlow, Ntot, and Nfrac (second row), and Npeak5, Apeak5, Npeak10, and Apeak10 (third row), colored green or red if passing or not passing the final limits (No. 46 in Table B.1), respectively. We note that lens candidates from C21 were only inspected by a single person for the group and cluster environment classifications and, thus, they have all only one vote. The figure continues in Appendix B. For all shown image stamps, north is up and east is left.
Current usage metrics show cumulative count of Article Views (full-text article views including HTML views, PDF and ePub downloads, according to the available data) and Abstracts Views on Vision4Press platform.
Data correspond to usage on the plateform after 2015. The current usage metrics is available 48-96 hours after online publication and is updated daily on week days.
Initial download of the metrics may take a while.


