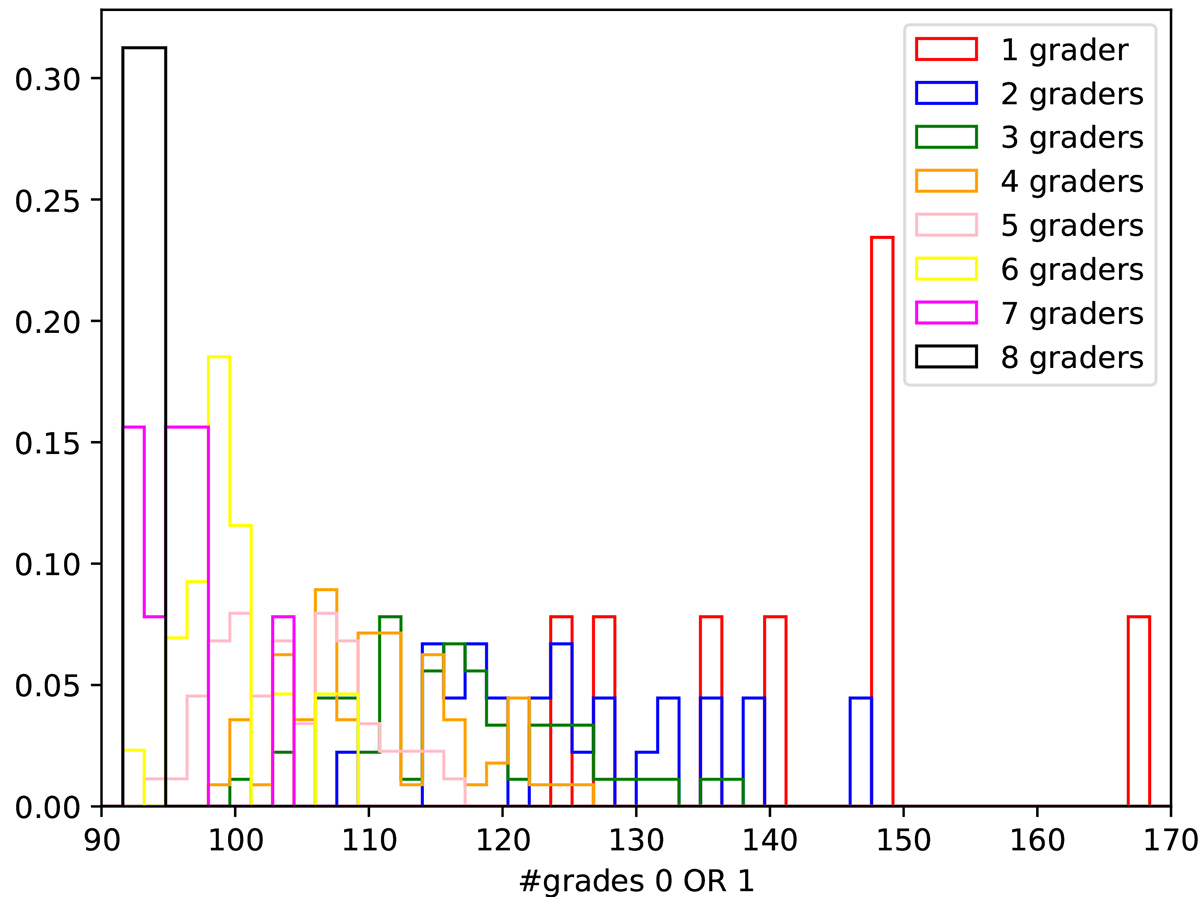
Fig. 1.
Download original image
Normalized histograms showing the distribution of 0 and 1 grades assigned in round #2 to network candidates from the overlap sample, containing 175 systems. We show all possible team combinations of the eight graders and only count systems that received a 0 or 1 by all graders of a particular team combination. Significant scatter is observed for small teams, which is expected and in agreement with R23.
Current usage metrics show cumulative count of Article Views (full-text article views including HTML views, PDF and ePub downloads, according to the available data) and Abstracts Views on Vision4Press platform.
Data correspond to usage on the plateform after 2015. The current usage metrics is available 48-96 hours after online publication and is updated daily on week days.
Initial download of the metrics may take a while.