Fig. 8
Download original image
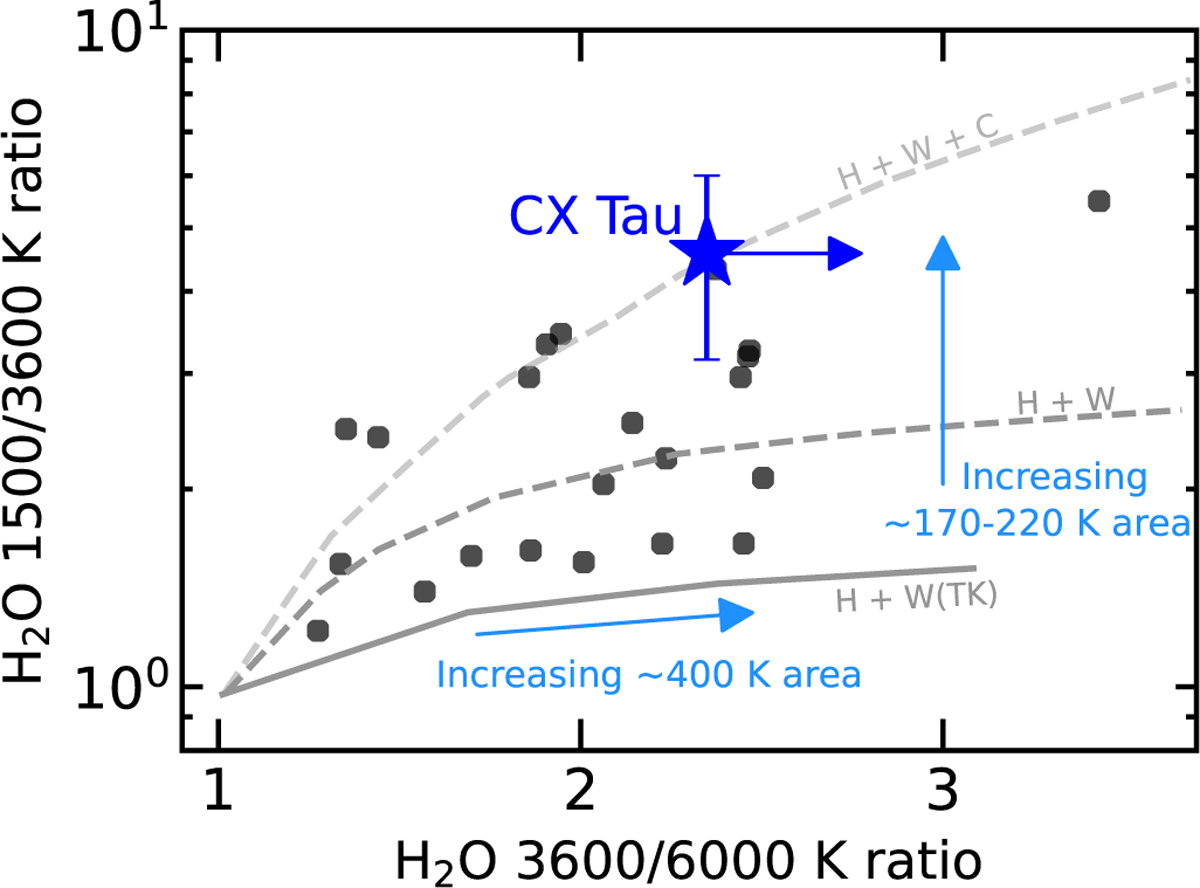
H2O diagnostic diagram from Banzatti et al. (2024), adapted to include the measured line ratios for CX Tau. Data points from Banzatti et al. (2024) (excluding data points with upper/lower limits) are indicated with black circles and the data point for CX Tau is indicated with a blue star. Three models from Banzatti et al. (2024) are shown: the model with a hot (850 K) and warm (400 K; optically thick) component is shown as a gray solid line (labeled “H + W (TK)”), the model with a hot (850 K) and warm (400 K; optically thin) component is shown as a dashed, gray line (labeled “H + W”), and the model with a hot (850 K), warm (400 K), and cold (190 K) component is shown as a dashed, light gray line (labeled “H + W + C”).
Current usage metrics show cumulative count of Article Views (full-text article views including HTML views, PDF and ePub downloads, according to the available data) and Abstracts Views on Vision4Press platform.
Data correspond to usage on the plateform after 2015. The current usage metrics is available 48-96 hours after online publication and is updated daily on week days.
Initial download of the metrics may take a while.