Fig. 5
Download original image
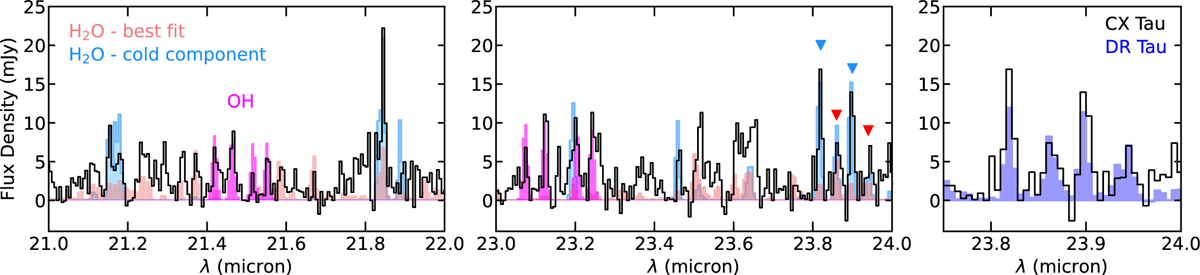
Three panels showing a zoom-in of the 21–22 µm region, the 23–24 µm region, and the 23.75–24 µm region, respectively, of the CX Tau spectrum (black). The left and middle panels show a warm H2O slab model in light pink (the best-fit model to the 13.5–17.5 µm region), a colder (175 K) slab model in light blue and an OH slab model in magenta. Blue and red triangles denote H2O lines that demonstrate the presence of a cold H2O component in CX Tau (see text). The right panel shows the spectrum of CX Tau in black and the spectrum of DR Tau (Temmink et al. 2024a,b) in dark blue. The spectrum of DR Tau has been scaled to match the flux of the 23.87 µm line.
Current usage metrics show cumulative count of Article Views (full-text article views including HTML views, PDF and ePub downloads, according to the available data) and Abstracts Views on Vision4Press platform.
Data correspond to usage on the plateform after 2015. The current usage metrics is available 48-96 hours after online publication and is updated daily on week days.
Initial download of the metrics may take a while.