Open Access
Fig. 4
Download original image
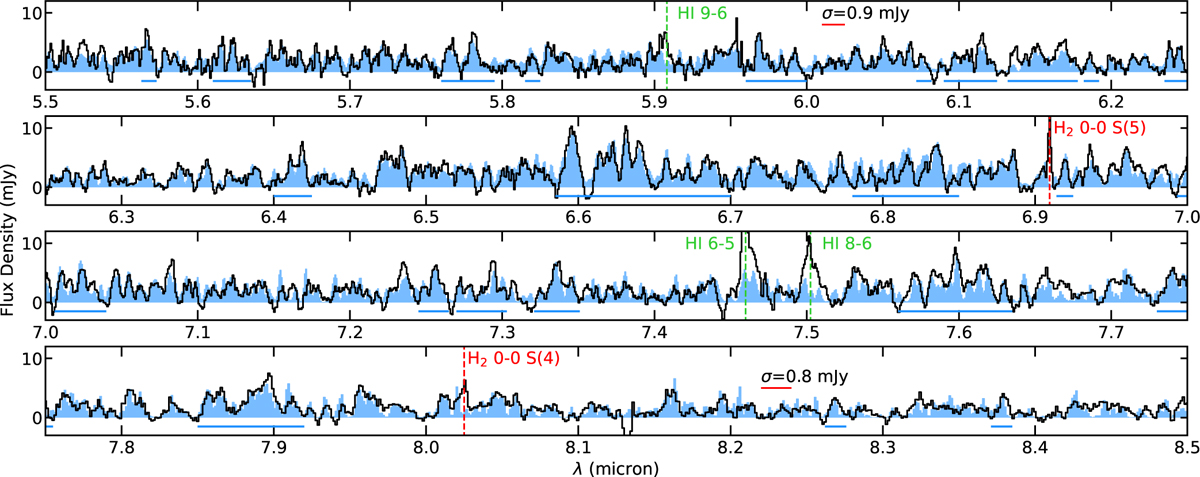
Four panels showing a zoom-in of the 5.5–8.5 µm region of the CX Tau spectrum (black), together with the H2O slab model fits (blue). The four different panels show the regions which were used to perform the H2O χ2 fits with horizontal blue bars.
Current usage metrics show cumulative count of Article Views (full-text article views including HTML views, PDF and ePub downloads, according to the available data) and Abstracts Views on Vision4Press platform.
Data correspond to usage on the plateform after 2015. The current usage metrics is available 48-96 hours after online publication and is updated daily on week days.
Initial download of the metrics may take a while.