Fig. B.3
Download original image
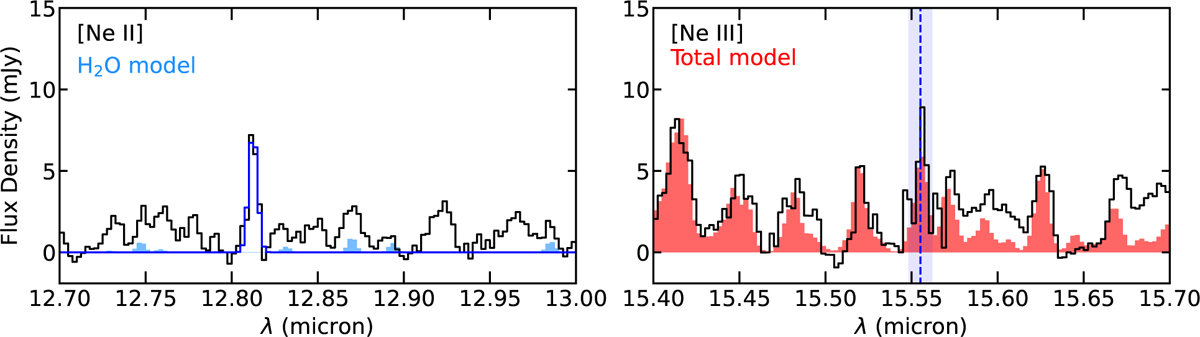
Zoom-ins of the CX Tau spectrum (black) around the [Ne II] and [Ne III] lines. In the left panel, a Gaussian fit to the [Ne II] line is shown in dark blue together with the best-fit H2O model from the 13.5-17.5 µm range in light blue. In the right panel, the combined model containing 12CO2,13CO2, HCN, C2H2, H2O, and OH is shown in red. A blue dashed line indicates the position of the [Ne III] line and the shaded region surrounding it indicates the region in which the upper limit on its flux is derived.
Current usage metrics show cumulative count of Article Views (full-text article views including HTML views, PDF and ePub downloads, according to the available data) and Abstracts Views on Vision4Press platform.
Data correspond to usage on the plateform after 2015. The current usage metrics is available 48-96 hours after online publication and is updated daily on week days.
Initial download of the metrics may take a while.