Fig. A.5
Download original image
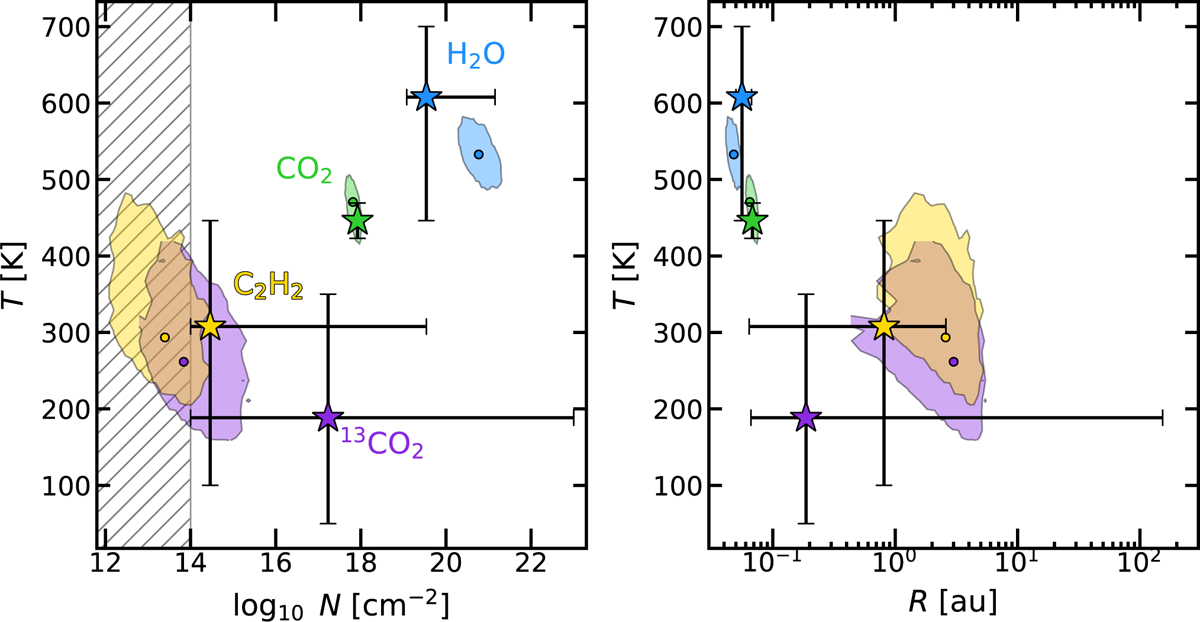
Comparison between the MCMC routine and our step-by-step fitting routine. The stars represent the best-fit results from the step-by-step fits with 1 σ errorbars. The small circles represent the best-fit results from the MCMC and the colored area represents a 3 σ confidence. The hatched area in the left panel demonstrates the parameter space that is covered by the MCMC, but not the step-by-step routine.
Current usage metrics show cumulative count of Article Views (full-text article views including HTML views, PDF and ePub downloads, according to the available data) and Abstracts Views on Vision4Press platform.
Data correspond to usage on the plateform after 2015. The current usage metrics is available 48-96 hours after online publication and is updated daily on week days.
Initial download of the metrics may take a while.