Open Access
Fig. A.3
Download original image
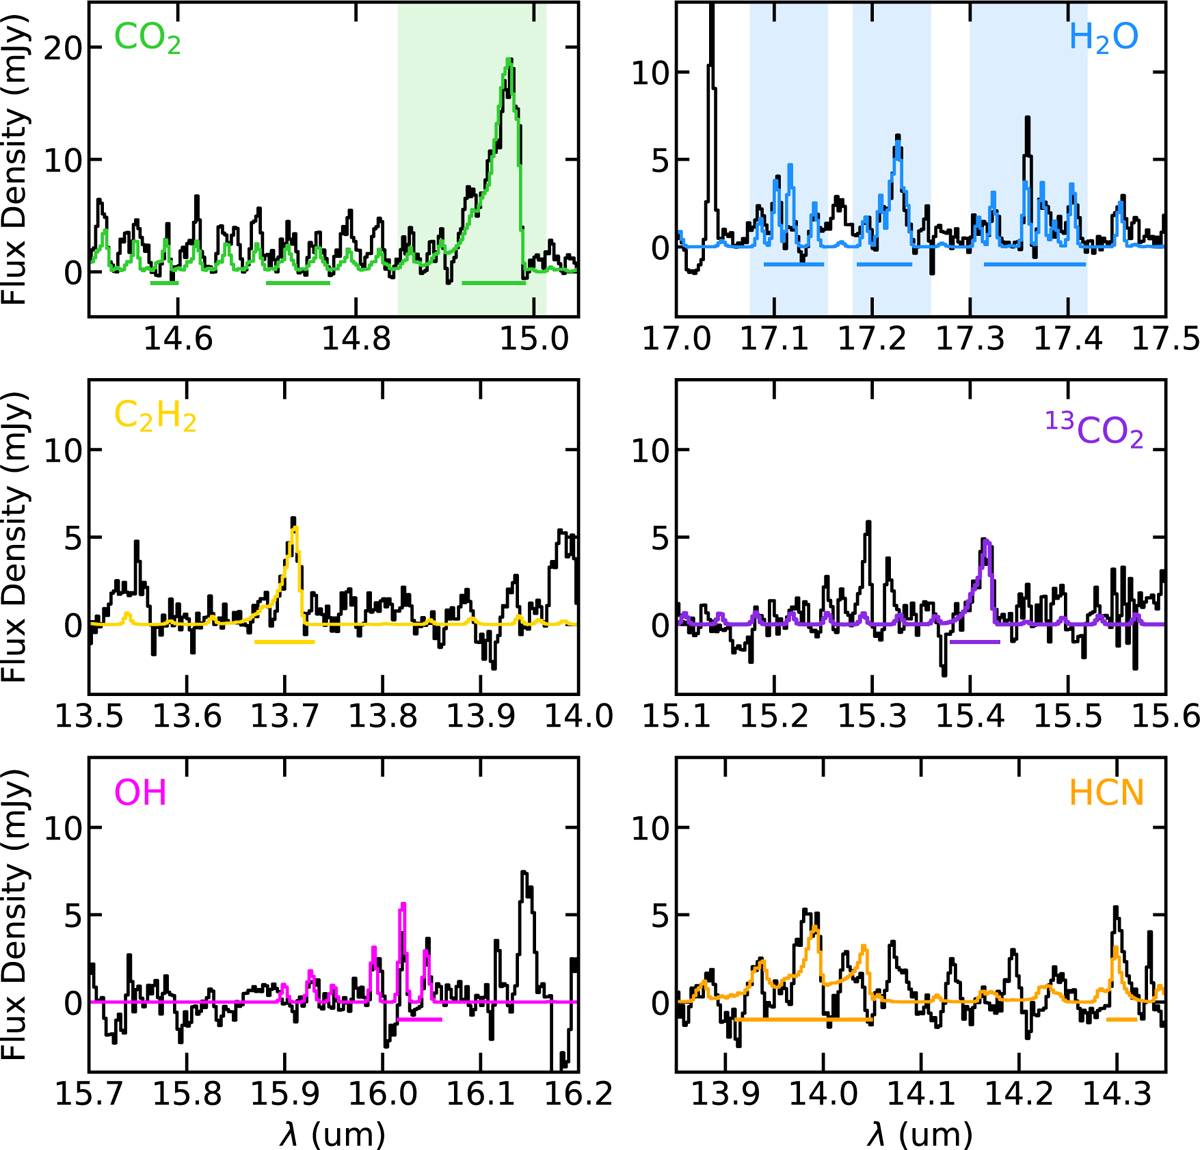
Various zoom-ins of Figs. A.1 and A.2, to depict the goodness of the individual slab fits. Horizontal bars indicate which spectral windows were used for the χ2 fit. The vertical shaded regions indicate the windows used to calculate the CO2 and H2O fluxes, following Salyk et al. (2011) and Najita et al. (2013).
Current usage metrics show cumulative count of Article Views (full-text article views including HTML views, PDF and ePub downloads, according to the available data) and Abstracts Views on Vision4Press platform.
Data correspond to usage on the plateform after 2015. The current usage metrics is available 48-96 hours after online publication and is updated daily on week days.
Initial download of the metrics may take a while.