Fig. 3.
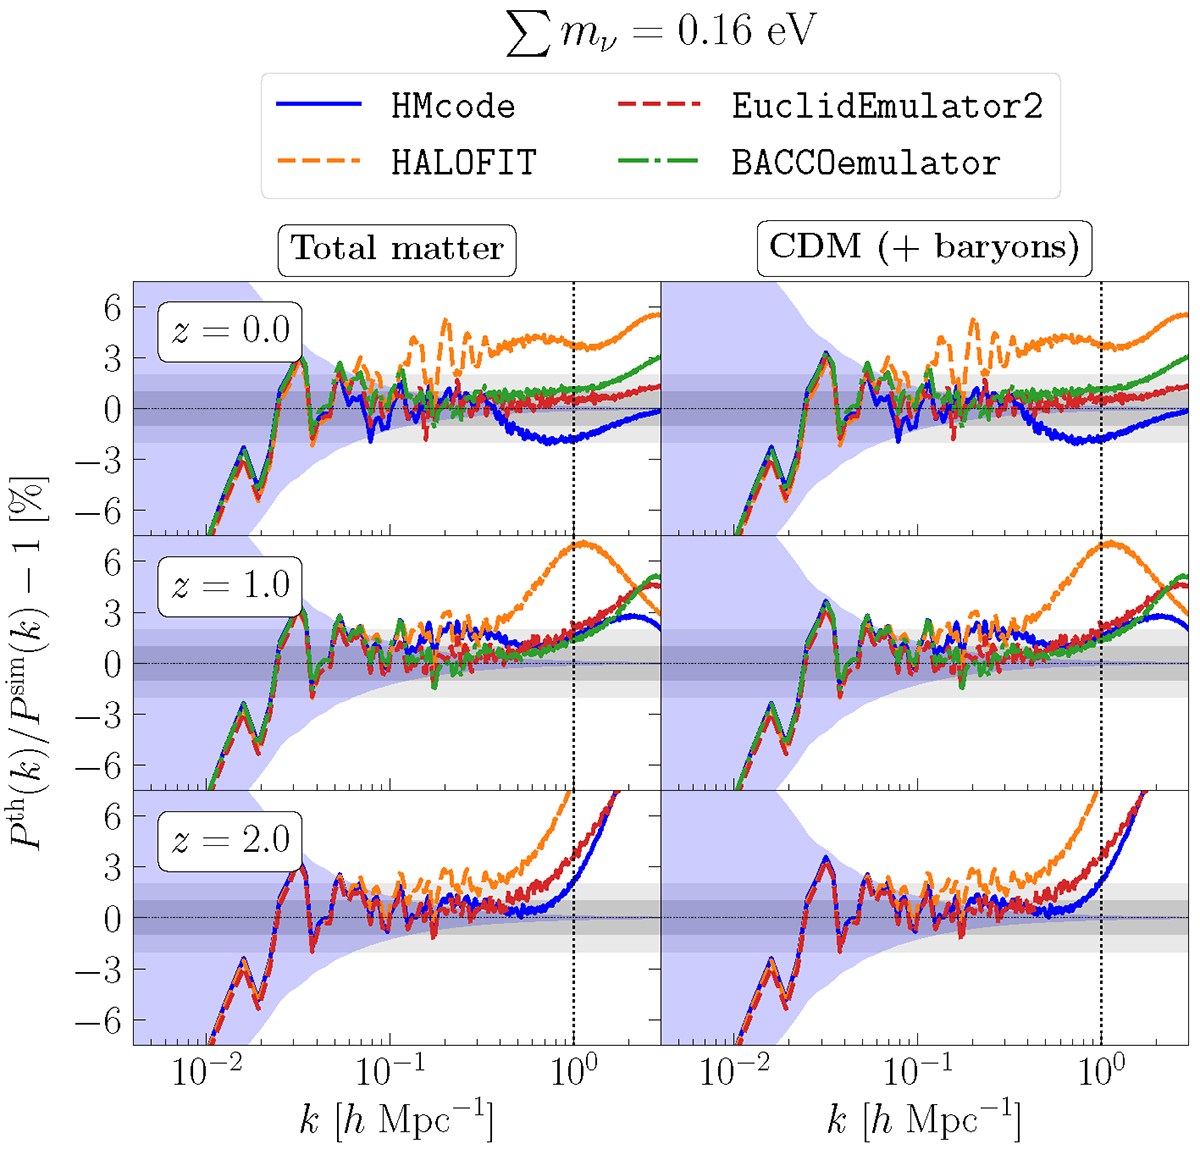
Download original image
Relative percentage difference of the nonlinear power spectrum computed with various recipes with respect to the DEMNUni simulations for the case ∑mν = 0.16 eV. We note that here, contrary to the forecast analysis, and to be consistent with the DEMNUni simulations, we assume the total neutrino mass to be equally shared among the three neutrino species m1 = m2 = m3 = ∑mν/3. The left column shows the total matter power spectrum, while the right column shows the cold dark matter power spectrum. The spectra are evaluated at z = 0, 1, 2 (first, second and third rows, respectively). The theoretical predictions are provided by HALOFIT (dashed orange line), HMcode (solid blue line), EuclidEmulator2 (dashed red line), and BACCOemulator (dot-dashed green line). The purple shaded area represents the shot noise of the simulations, and the vertical dotted line the maximum wavenumber. In the third row the predictions of BACCOemulator are missing because the emulator is trained only up to z = 1.5. The predictions for the cold dark matter power spectrum (neglecting the contribution of neutrino perturbations) is computed according to the approximate formula Eq. (16) (see text for details).
Current usage metrics show cumulative count of Article Views (full-text article views including HTML views, PDF and ePub downloads, according to the available data) and Abstracts Views on Vision4Press platform.
Data correspond to usage on the plateform after 2015. The current usage metrics is available 48-96 hours after online publication and is updated daily on week days.
Initial download of the metrics may take a while.