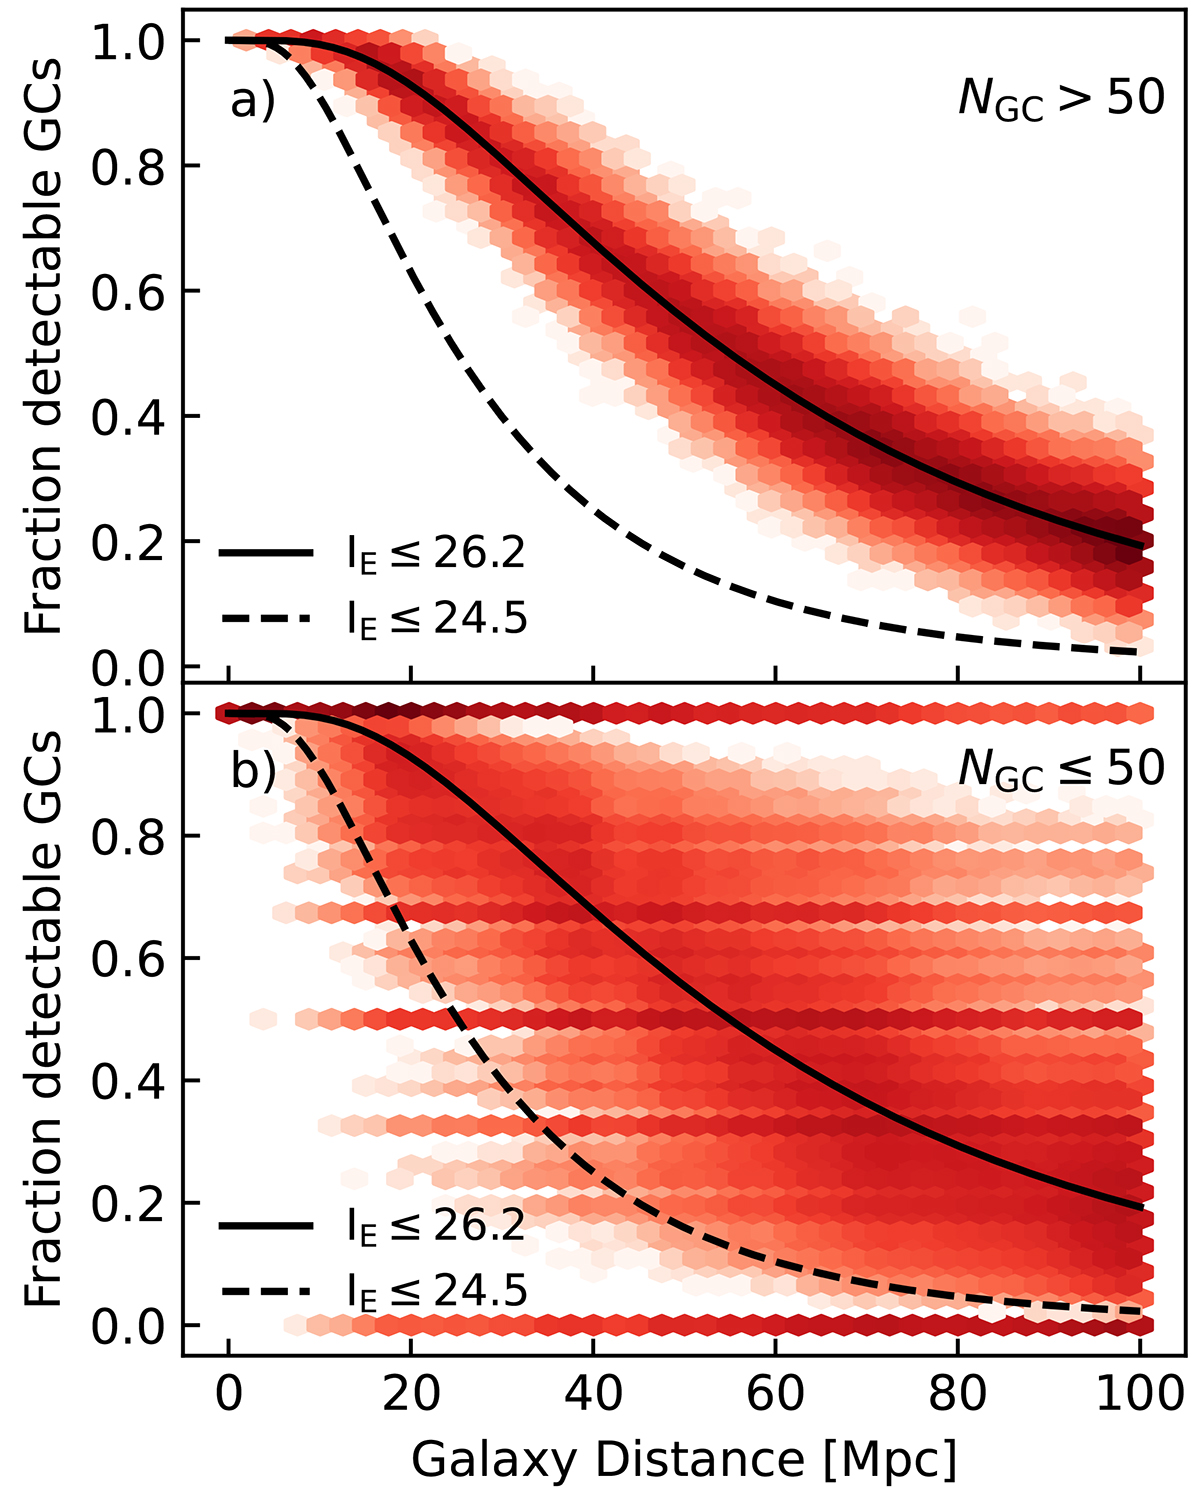
Fig. 6.
Download original image
Fraction of simulated GCs that are above the detection threshold as a function of distance, for each galaxy in the HECATE-based sample. The two-dimensional density represented with red shaded bins summarizes the theoretical GC detectability fraction of all galaxies in 100 Monte-Carlo realisations (i.e., 100 × 26 711 galaxies). The solid line is the analytic predicted fraction for IE ≤ 26.2 and the dashed line is for IE ≤ 25. Panel a: Only systems with NGC > 50. Panel b: Only GC systems with NGC ≤ 50 to illustrate the stochasticity introduced by small galaxies and their small total number of GCs.
Current usage metrics show cumulative count of Article Views (full-text article views including HTML views, PDF and ePub downloads, according to the available data) and Abstracts Views on Vision4Press platform.
Data correspond to usage on the plateform after 2015. The current usage metrics is available 48-96 hours after online publication and is updated daily on week days.
Initial download of the metrics may take a while.