Fig. 5.
Download original image
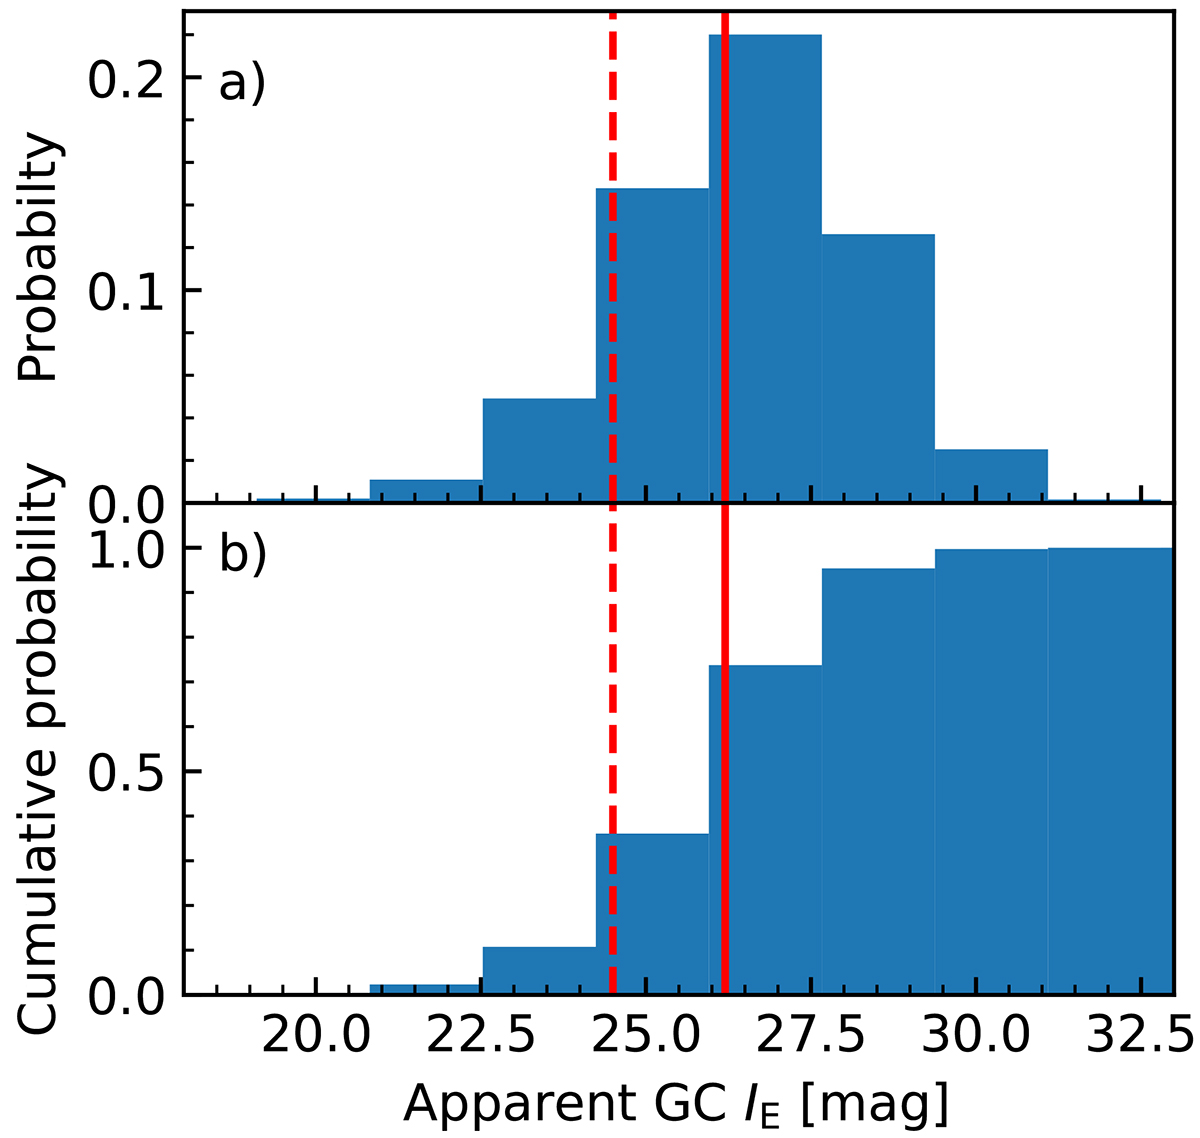
Magnitude distribution of all predicted GCs. Panel a: Distribution of apparent magnitudes of all expected GCs hosted by galaxies out to 100 Mpc. Panel b: Cumulative distribution of the relative number of GCs. The solid red line marks the VIS point source detection threshold of 26.2 and the dashed line marks 24.5 as the magnitude limit in which GCs will also be detected in NISP (see Fig. 7).
Current usage metrics show cumulative count of Article Views (full-text article views including HTML views, PDF and ePub downloads, according to the available data) and Abstracts Views on Vision4Press platform.
Data correspond to usage on the plateform after 2015. The current usage metrics is available 48-96 hours after online publication and is updated daily on week days.
Initial download of the metrics may take a while.