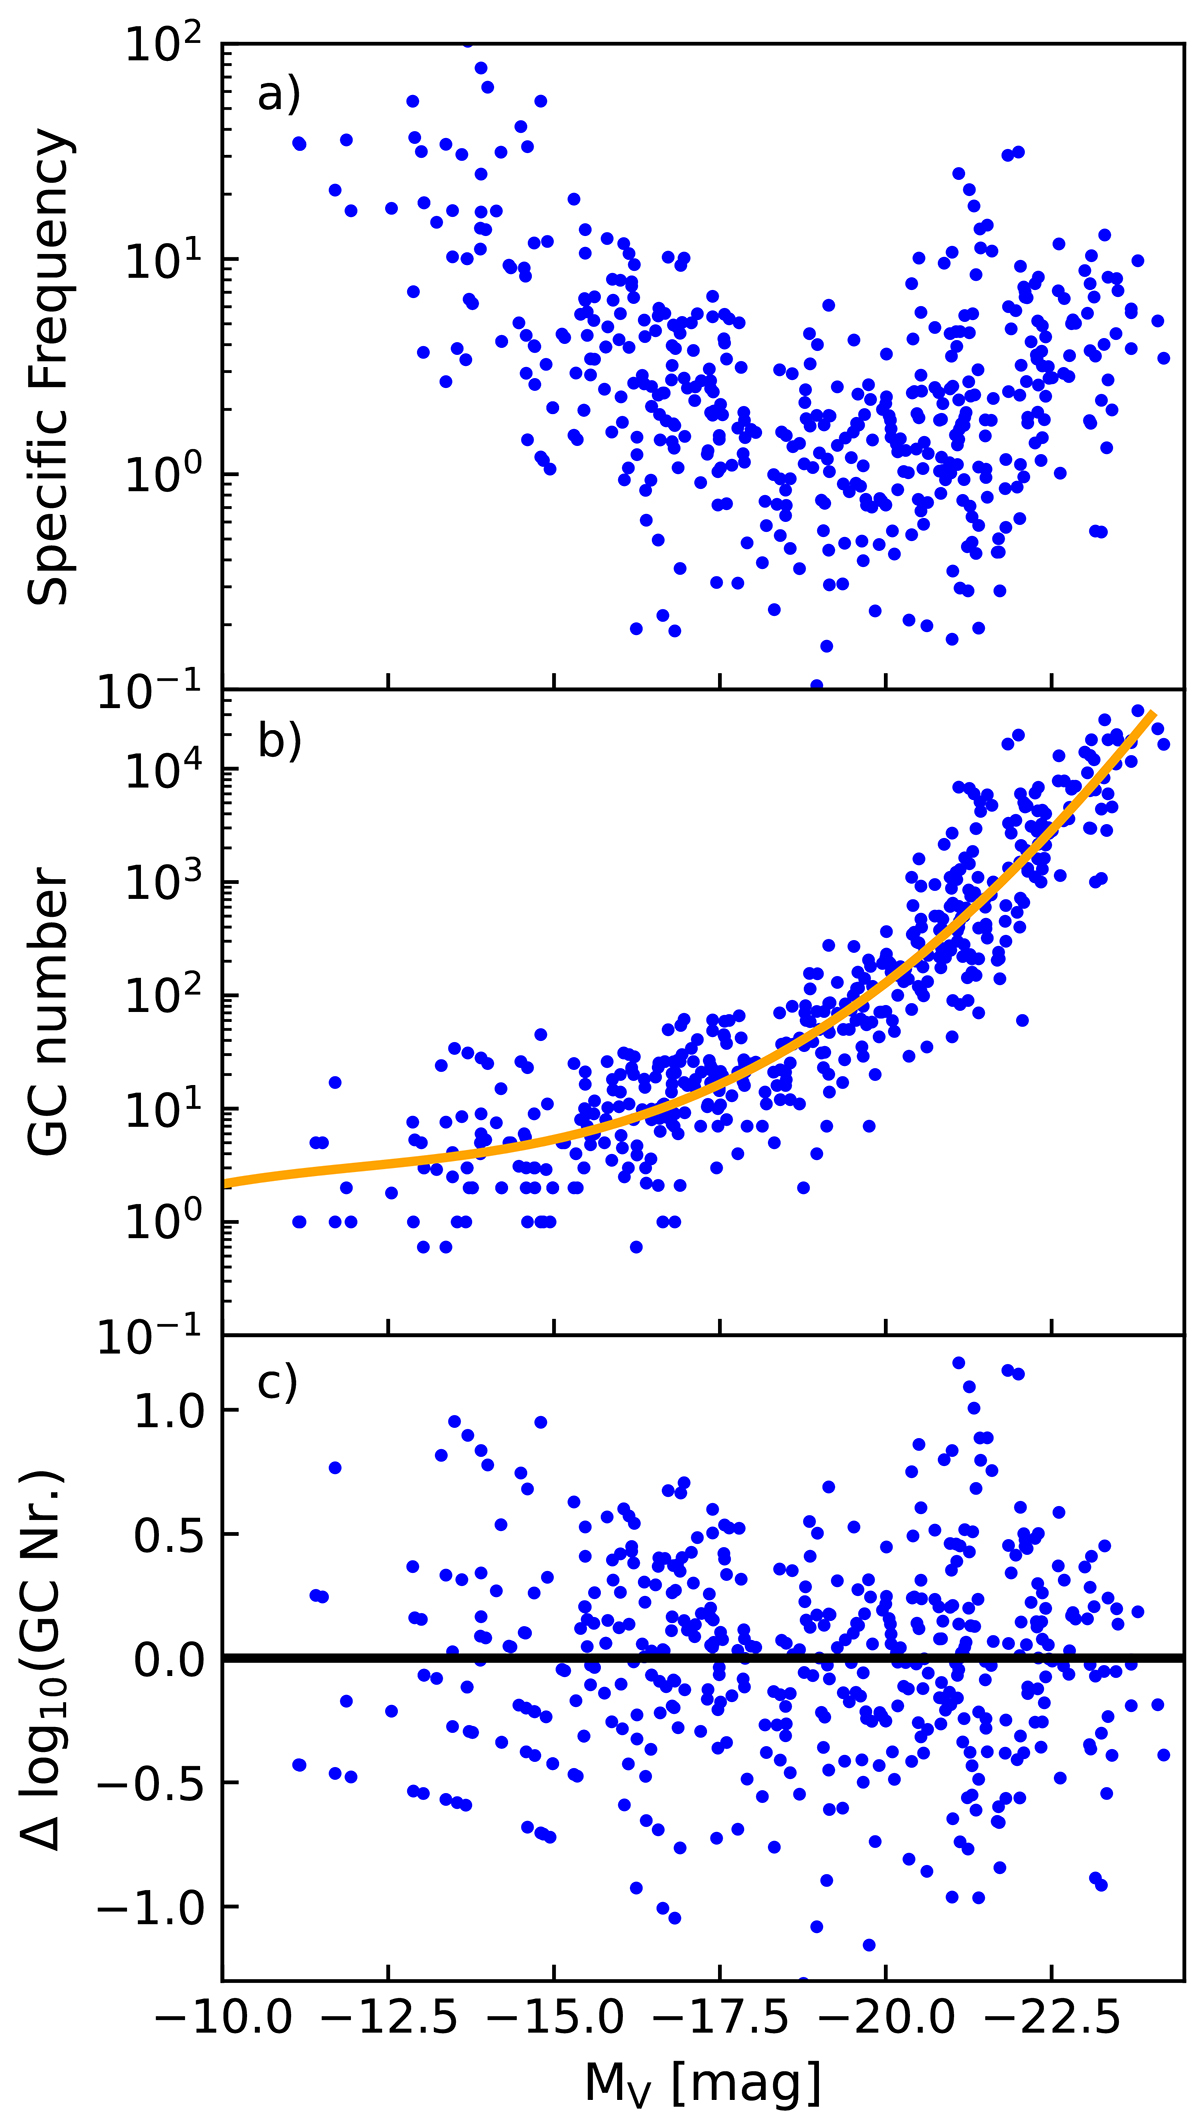
Fig. 3.
Download original image
Predicted GC numbers as a function of magnitude. Panel a: Specific frequency of GCs as a function of host galaxy magnitude for our galaxy catalogue. Panel b: Total GC number in each galaxy as a function of its magnitude. A polynomial fit to the data is shown as orange line. Panel c: Log difference between the mean GC number for a given galaxy magnitude (orange fit in the middle panel) and the actual GC number of each galaxy. The alignment of data points in the bottom half is a natural consequence of the small numbers of GCs where the difference is only a single or two GCs for those low-luminosity galaxies.
Current usage metrics show cumulative count of Article Views (full-text article views including HTML views, PDF and ePub downloads, according to the available data) and Abstracts Views on Vision4Press platform.
Data correspond to usage on the plateform after 2015. The current usage metrics is available 48-96 hours after online publication and is updated daily on week days.
Initial download of the metrics may take a while.