Fig. 14.
Download original image
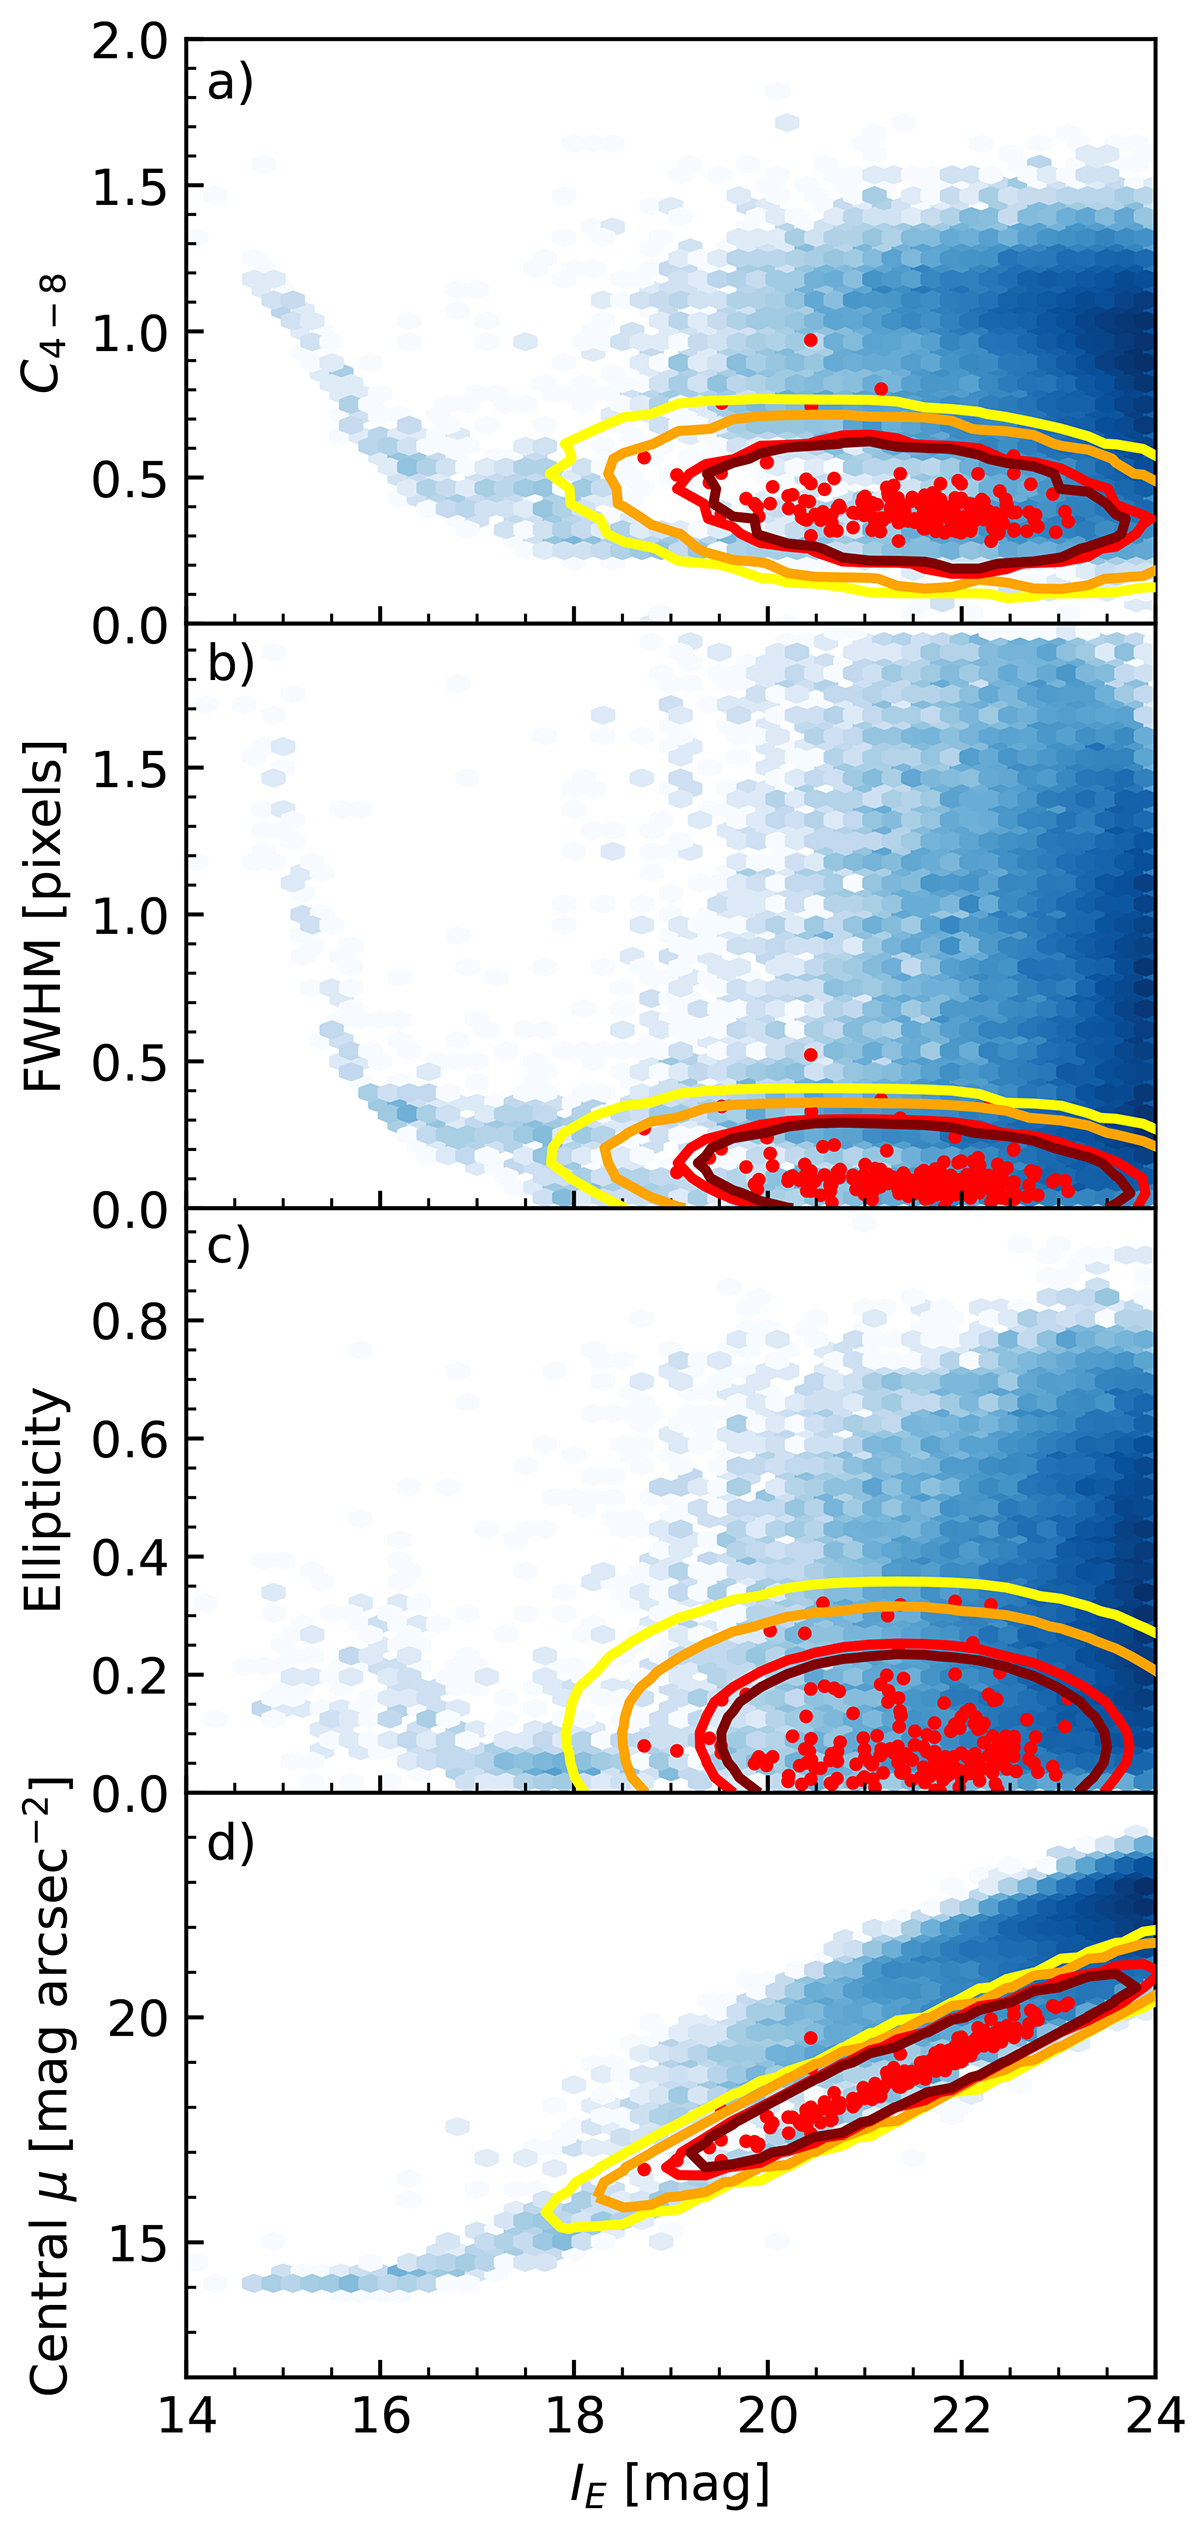
Parameters of detected sources against VIS IE magnitude. Panel a is the concentration index C4 − 8, which is the difference in magnitude between the aperture with a radius of 4 and 8 pixels. The parameter shown in panel b is the FWHM of the sources in arcsec, panel c is the ellipticity and panel d is the maximum surface brightness. All four parameters are derived from the ERO-Fornax catalogue and are intrinsic size parameters deconvolved with the PSF. Known GCs are shown as red symbols. The blue shaded density distribution represents all photometric sources in the Fornax FoV. The yellow, orange, red and maroon ellipses mark the levels that include 95%, 90%, 68%, and 50% of all known GCs in the Gaussian mixture output.
Current usage metrics show cumulative count of Article Views (full-text article views including HTML views, PDF and ePub downloads, according to the available data) and Abstracts Views on Vision4Press platform.
Data correspond to usage on the plateform after 2015. The current usage metrics is available 48-96 hours after online publication and is updated daily on week days.
Initial download of the metrics may take a while.