Fig. 6.
Download original image
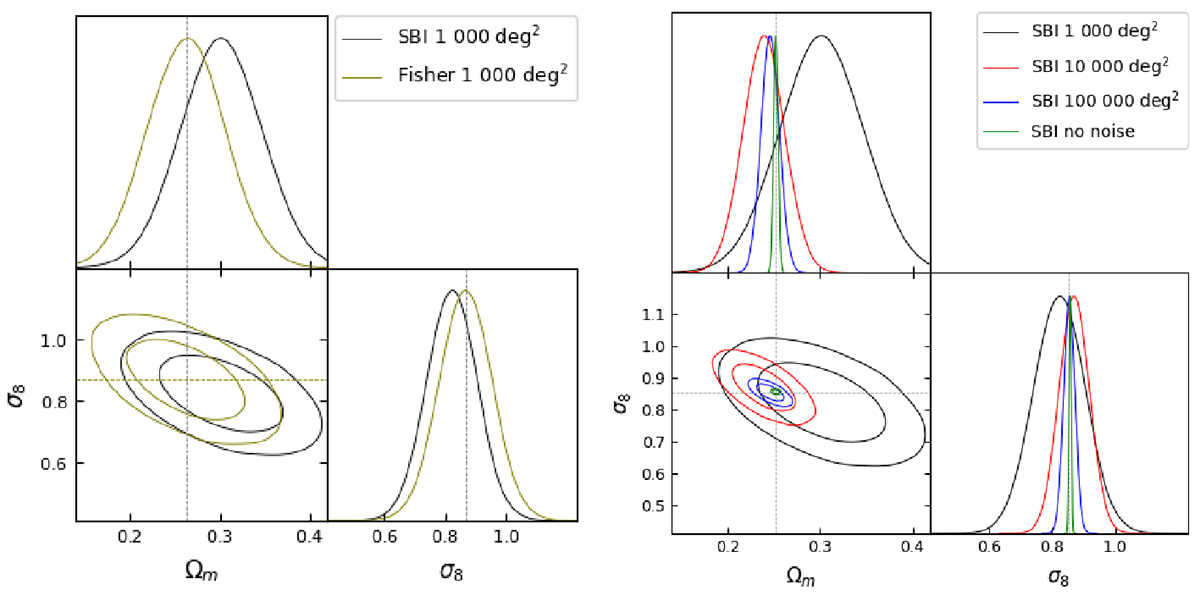
Left: Comparison of the NDE’s cosmological prediction with a Fisher prediction on the same target XOD corresponding to a 1000 deg2 survey area. Right: Comparison of the NDE’s cosmological results for four different survey areas. The NDE’s was trained on our D1 dataset, with dn/dz selection and free γ parameters. The y-axis in the 1D posterior probability distribution plots indicates the probability density at each parameter value shown on the x-axis. Each 1D probability density function is normalized in a way that the total area under its curve equals 1.
Current usage metrics show cumulative count of Article Views (full-text article views including HTML views, PDF and ePub downloads, according to the available data) and Abstracts Views on Vision4Press platform.
Data correspond to usage on the plateform after 2015. The current usage metrics is available 48-96 hours after online publication and is updated daily on week days.
Initial download of the metrics may take a while.