Open Access
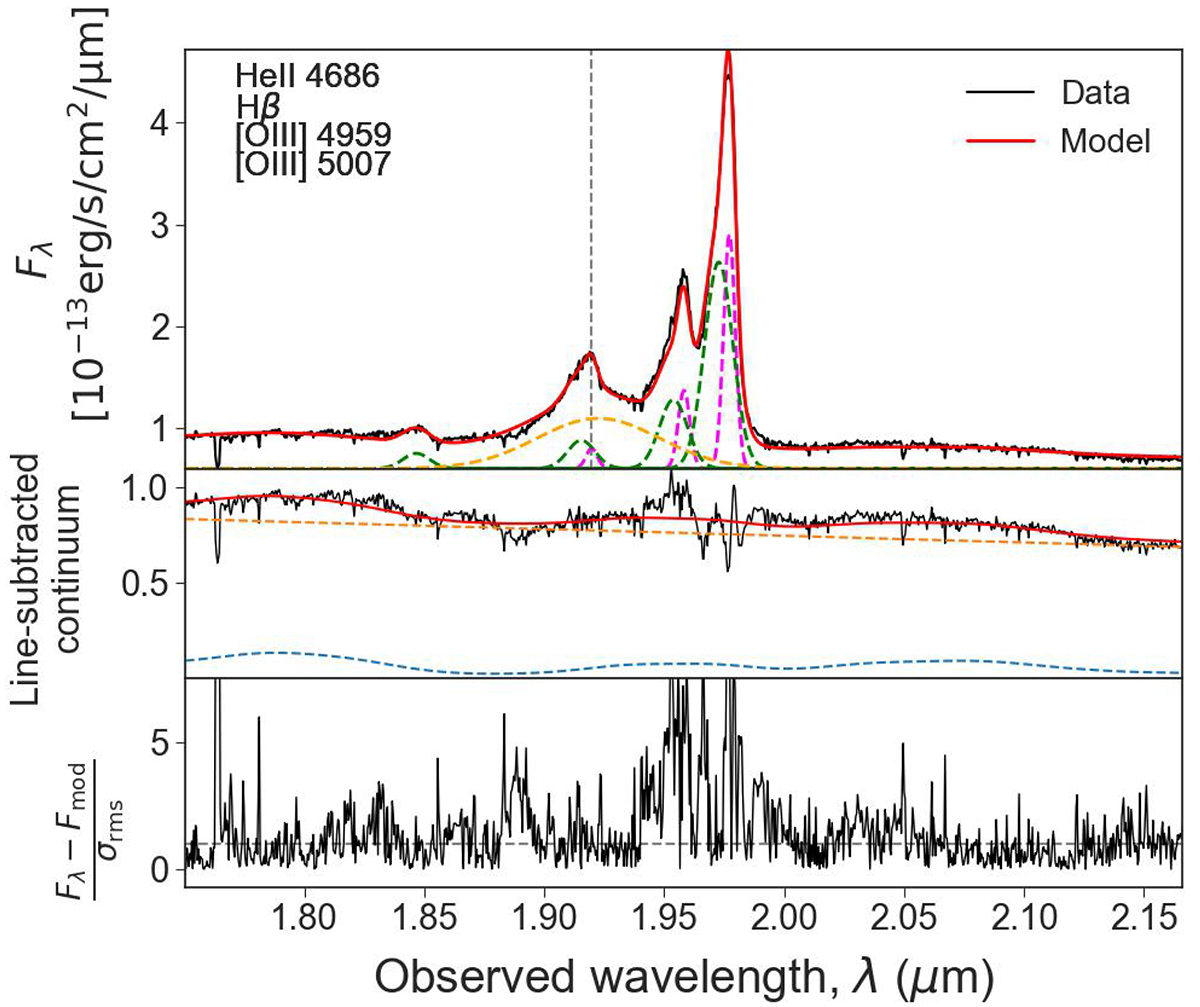
Fig. 3.
Download original image
Same as Fig. 1, but for the Hβ line covered by our NIRSpec observations. The dashed blue line in the middle panel shows the recovered contribution by the Fe II complex to the continuum, and the orange line is a linear fit to the residual continuum. The [O III] and He II lines are also covered, but not used in our analysis.
Current usage metrics show cumulative count of Article Views (full-text article views including HTML views, PDF and ePub downloads, according to the available data) and Abstracts Views on Vision4Press platform.
Data correspond to usage on the plateform after 2015. The current usage metrics is available 48-96 hours after online publication and is updated daily on week days.
Initial download of the metrics may take a while.