| Issue |
A&A
Volume 693, January 2025
|
|
|---|---|---|
| Article Number | A110 | |
| Number of page(s) | 7 | |
| Section | Interstellar and circumstellar matter | |
| DOI | https://doi.org/10.1051/0004-6361/202450152 | |
| Published online | 09 January 2025 | |
X-Ray emission from SN1885A
1
Dr. Karl Remeis-Sternwarte, Erlangen Centre for Astroparticle Physics, Friedrich-Alexander-Universität Erlangen-Nürnberg,
Sternwartstrasse 7,
96049
Bamberg,
Germany
2
Department of Physics & Astronomy, The University of Texas at San Antonio, One UTSA Circle,
San Antonio,
TX
78249,
USA
★ Corresponding author; This email address is being protected from spambots. You need JavaScript enabled to view it.
Received:
27
March
2024
Accepted:
3
November
2024
Abstract
The historical supernova (SN) S Andromedae (S And or SN1885A) in the Andromeda Galaxy (M31) was discovered in August 1885 and since then has been studied extensively in multi-wavelength observations. Although the remnant of S And could be detected in optical images, so far no X-ray source has been reported at the position of S And. In this work we report the first detection of X-ray emission from the remnant of SN1885A with a significance of σ = 3.43 using Chandra High-Resolution Camera (HRC) data taken in the imaging (I) mode. A total of 45 Chandra HRC-I observations were analysed, which corresponds to ~940 ks of exposure time. A faint X-ray source could be detected at the reported position of the supernova remnant (SNR) 1885 and the corresponding X-ray luminosity in the 0.1–10 keV band was obtained. The resulting value from merging all 45 observations amounts to L0.1 − 10 keV = (6−3+4) × 1033 erg s−1. To contextualise the results, the luminosity was compared to the X-ray luminosities of four of the oldest known X-ray SNe, some younger Galactic remnants, some SNRs in M31, and to theoretical predictions. The X-ray luminosity of SNR1885 is three to four orders of magnitude lower compared to the other examined remnants. A comparison to theoretical models shows that such low X-ray luminosities can only be produced if the ejecta is still expanding freely into a low-density interstellar medium (ISM). On the other hand, strong absorption by a high-density medium surrounding the freely expanding ejecta could also account for the lack of X-ray emission. Furthermore, the extremely low emission in X-rays could be an indication that the X-ray luminosity decreases faster towards the end of the ejecta-dominated (ED) phase in the evolution of SNRs than in the beginning.
Key words: ISM: supernova remnants / galaxies: individual: M31 / X-rays: individuals: SN1885A / X-rays: individuals: S And
© The Authors 2025
 Open Access article, published by EDP Sciences, under the terms of the Creative Commons Attribution License (https://creativecommons.org/licenses/by/4.0), which permits unrestricted use, distribution, and reproduction in any medium, provided the original work is properly cited.
This article is published in open access under the Subscribe to Open model. This email address is being protected from spambots. You need JavaScript enabled to view it. to support open access publication.
1 Introduction
The observation of the supernova (SN) 1885A (SN1885A, S Andromedae or S And) in the Andromeda Galaxy (M31) was announced publicly for the first time on 31 August 1885 by Ernst Hartwig, astronomer at the Dorpat Observatory in Estonia at the time and later director of the Dr. Karl Remeis- Sternwarte in Bamberg (Greafe et al. 2015). Several decades later, Hartwig revealed that he noticed the SN for the first time on 20 August 1885 in the 9 in-Dorpat refractor and had refrained from addressing the public until he was able to confirm his observations. Hartwig measured visual magnitudes from at least 6 mag on 20 August to around 8 mag in early September. M31 had been reported to appear unusually bright since the beginning of August 1885, one record even dating back to the beginning of July 1885. The SN remained visible for several months but eventually faded and was sighted for the last time on 7 February 1886. As Hartwig made the first public announcement about the occurrence and was the first to understand its importance, he was given credit for the discovery of S And (Jones 1976).
A definitive visual light curve of S And was presented by de Vaucouleurs & Corwin (1985) after reviewing all the available data between the end of August 1885 and the beginning of March 1886. Furthermore, they performed a spectral analysis, which revealed a good match of the detected emission lines with those expected in spectra of type Ia-SNe. Hydrogen Balmer lines were found to be absent, which is in agreement with previous spectroscopic observations for example by Gaposchkin (1936).
The Fe I absorption in the remnant of S And observed by Fesen et al. (1989) provides another argument for the classification as a type Ia-event. However, de Vaucouleurs & Corwin (1985) also noted that S And was sub-luminous compared to other typical type I-SNe and has a light curve with one of the fastest rise and decline ever recorded, especially with regard to the initial decline (2 mag in 12.5 days). Moreover, itis stated that the colour at maximum and in the two to three weeks thereafter is unusually red for a type I-SN (B – V = +1.31 ± 0.06). Apart from the maximum, colour and luminosity evolved as expected. S And is classified as type I peculiar by de Vaucouleurs & Corwin (1985).
Graham (1988) compared the visual light curve of SN1885A to that of SN1984A, a type Ia-event in NGC 4419. A striking similarity between the two SNe is found, based on which Graham classifies S And as type Ia despite its unusual light curve. The classification as a type Ib is briefly considered and ruled out due to comparisons to the spectra of other type Ib-events.
Chevalier & Plait (1988) disagree with Graham (1988) and state that S And is different from both type Ia and Ib for mainly three reasons, similar to those found by de Vaucouleurs & Corwin (1985): the rapid rise of the visual magnitude to maximum (~4 days from 3 mag below maximum to maximum; usual time scale for type I 14 ± 2 days), the rapid decline rate after maximum (0.10 ± 0.01 mag day−1; usually 0.065 ± 0.007 mag day−1) and the large change in magnitude from maximum to 150 days post maximum (∆m = 7.5 mag; usually ∆m ≈ 5 mag). Due to model calculations, they assume a low mass explosion and, combined with the assumption of an old stellar population in the bulge of M31 where the event took place, subsequently suggest a white dwarf progenitor in a binary system.
The light curve of SN1885A was re-examined by van den Bergh (2002) and a classification as a sub-luminous type Ia-event was considered based on the above mentioned unusual features of the light curve and comparison to other sub-luminous type Ia- SNe. However, it is also suggested that S And could have been some other sub-type of type I-SNe.
Evidently, S And is generally believed to be a type Ia-SN based mainly on its spectral features. However, while sources widely agree on the classification as a type I-SN, the determination of the sub-type is less agreed upon.
The remnant of S And (SNR1885) was discovered in 1988 by Fesen et al. (1989) in optical absorption images within 1 arcsec of the historical location of SAnd in the bulge of M31. The images were taken with the ground-based 4 m-telescope at Kitt Peak National Observatory in Arizona on 9 November 1988, using two passband filters, creating ‘on’ and ‘off’ Fe I absorption images. By creating a ratio image of on- and off-band images, absorption of dust is suppressed, thereby improving the visibility of the supernova remnant (SNR) itself. Fesen et al. (1989) concluded from their observations that SNR1885 was most likely still in the ejecta-dominated free expansion phase (ED phase) with largely cool, iron-rich ejecta. They estimated a maximal expansion velocity of ±5000 km s−1 and placed SAnd on the side of the bulge of M31 facing the Milky Way.
Later on, the SNR was studied in further detail with the Hubble Space Telescope (HST). On 7 August 1995, Fesen et al. (1999) again obtained Fe I (λ = 3860 Å) on- and off- band absorption images, using two different filters. Curiously, the remnant did not really show in the on-band images, but rather in the off-band images, where a dark absorption spot was visible at the location of S And. This led to the conclusion that the observed absorption was not largely due to Fe I, as previously assumed, but rather caused by Ca II at 3934 Å and 3968 Å for the most part. Aside from Ca II, absorption lines of Ca I (4227 Å) and Fe I (3934 Å) were identified. These low-ionised elements are well in agreement with the assumption of unshocked and freely expanding ejecta. A diameter of 0.70 ± 0.05 arcsec was measured, which corresponds to a diameter of 2.5 ± 0.4 pc at an assumed distance of 725 ± 70kpc to M31 (~2.6pc at our adopted distance of 780 kpc), implying an expansion velocity of 11 000 ± 2000 km s−1 . The expansion velocity was also estimated from the line profiles in the measured spectra and amounts to roughly 13 000 ± 1500 km s−1 (Fesen et al. 1999).
In 2007, Fesen et al. (2007) presented another optical study of SNR1885, analysing HST images with distinctly higher angular resolution than before. The observations took place between August and November in 2004 and allowed examination of the Ca and Fe distributions in the remnant as well as investigation of possible explosion scenarios. A variety of filters was used to obtain absorption images in different wavelength ranges. These included absorption lines of CaI, Ca II, a continuum band without strong absorption lines as well as Fe I and Fe II lines in the ultraviolet (UV). The remnant was visible best in Ca II H and K line absorption. Further analysis revealed Ca II absorption ‘clumps’ of about 0.05 arcsec in size (~0.20pc at 785 kpc, ~0.19pc at our adopted distance of 780kpc). The existence of a ‘broken ring of Ca II clumps’ at a radius of about 0.2 arcsec is proposed. Apart from the clump structures the Ca II absorption seemed to be fairly even within a radius of 0.2 arcsec. The remnant appears to be spherical in Ca II absorption and the diameter of the entire absorption feature was measured to be about 0.80 ± 0.05 arcsec. The angular size corresponds to a diameter of 1.52 ± 0.15 pc at a distance of 785 ± 30kpc to M31 (~1.51 pc at our adopted distance of 780 kpc), implying an expansion velocity of 12 400 ± 1400 km s−1. This value matches the expansion velocity obtained from the spectra in Fesen et al. (1999) (13 000 ± 1500 km s−1), which further indicates that SNR1885 is freely expanding.
As of today, the remnant of S And has neither been detected in radio nor in X-rays. Radio observations of M31 with the Very Large Array (VLA) have, however, allowed to obtain an upper limit on the luminosity at the reported location of S And. Dickel & Dodorico (1984) presented a radio study of SNRs in M31 at a wavelength of 6.1 cm in 1983 and determined an upper limit of 0.2 mJy within a beam of 1.3 × 1.0 arcsec2. This corresponds to a luminosity of less than 1 × 10²³ erg s−1 Hz−1 at 6 cm, assuming a distance of 800 kpc to M31. They note that this value is about two orders of magnitude smaller than the values determined for other historical type I-SNe in NGC 5253, about 0.4 times the luminosity of Tycho’s SNR, and 1.3 times that of Kepler’s SNR. Observations of M31 with the Chandra X-Ray Observatory (CXO) by Kaaret (2002) reveal an X-ray source in close proximity to the location of S And. However, the alignment of the X-ray images with HST observations places the source 1.3 arcsec (=ˆ 4.9 pc at the adopted distance of M31) from the position of the optical absorption feature identified as SNR 1885. This indicates that the source is not the X-ray counterpart of the remnant. In near UV HST images, a bright point source is visible within 0.15 arcsec of the discovered X-ray source, which gives a further reason not to associate the Chandra source with S And. Based on its estimated flux (3.5 × 10⁻¹⁶ erg s−1 cm−2 Å−1), the source is suspected to be an optical nova instead.
In this work, potential X-ray emission from SNR1885 is investigated using data taken with the High-Resolution Camera (HRC) of the Chandra X-ray Observatory (Weisskopf et al. 2002) of the central region of M31. A distance of 780 kpc to M31 is adopted (Bhardwaj et al. 2016). In Section 2, the data analysis is presented in detail, in Section 3 theoretical predictions for the X-ray emission from SNRs are discussed and the results obtained for SNR1885 are compared to the theory, as well as to other known Galactic and extra-galactic SNRs. The conclusions are summarised in Section 4.
ObsIDs of all 45 Chandra HRC-I observations used for the data analysis in this work.
2 Data analysis
For the analysis presented here, Chandra HRC data taken in the imaging (I) mode from 45 different observations of M31 between 2001 and 2012 (see Table 1) were processed using the Chandra Interactive Analysis of Observations (CIAO) software package versions 4.12 and 4.151. This corresponds to a total exposure time of ~940ks. In a first step, each data set was reprocessed using the ‘chandra_repro’ script to recalibrate the data and create new level=2 event files, as is recommended in the CIAO documentation. To investigate potential X-ray emission from SNR1885, a merged image of the central region of M31 has to be created. The necessary analysis steps and data preparation are described in the following.
2.1 Astrometric corrections
Prior to merging the observations, astrometric corrections need to be applied to each data set to ensure all the observations are aligned and no sources are detected more than once. In order to calculate these astrometric shifts, first a list of all the sources in the respective observation was generated by creating an image and then running a source detection tool. The images were obtained with the CIAO tool ‘fluximage’, which creates exposure corrected images for a Chandra observation from the level=2 event file. The energy band was set to the complete HRC- I energy range (0.1–10 keV) with a centre energy of 1.1 keV. However, as HRC’s energy resolution is rather low, the centre energy value is not as relevant. A binning parameter of 8 was chosen, which means one pixel corresponds to about 1 arcsec. It should be mentioned that these images were only used to run the source detection in order to calculate the astrometric correction parameters. To obtain information about the X-ray flux of SNR1885, unbinned merged images were created from the corrected level=2 event files (see Sect. 2.2). For the source detection, the CIAO tool ‘wavdetect’ was used. Before running wavde- tect, the point spread function (PSF) map needs to be created. This is done using the script ‘mkpsfmap’, which looks up the radius of Chandra’s PSF for each pixel in a given image at a specific energy, assuming a circular PSF. In this particular case, the energy parameter was again set to 1.1 keV.
Once the source detection is completed, the positional correction parameters can be determined by cross-matching the resulting source list to either the source list of another Chandra observation or an external catalogue for an absolute astrometry correction. Unfortunately, the considered region in M31 is so crowded that the latter is not possible as the source list would have to be limited to Galactic foreground stars or known active galactic nuclei (AGN). In an attempt to cross-match the detected sources to the USNO-A2.0 catalogue2 the correction did not improve compared to Chandra’s pointing accuracy. Consequently, we decided to only correct the relative positions of the observations to each other. Ideally, the observation with the longest exposure time should be chosen as reference, which in this case is the data set with observation identifier (ObsID) 1912 with an exposure time of 46.73 ks. It is assumed that because of the higher statistics, the source positioning of longer observations is better compared to shorter observations. The cross matching was done using the CIAO tool ‘wcs_match’, which shifts the positions of the sources on the input list to those in the reference file, so that their distances are minimised. As an output, the matrix coefficients corresponding to the shift are given:
 (1)
(1)
In Eq. (1), X′ and Y′ describe the shifted and X and Y the original source coordinates. Possible rotation is described by a1, a2, a3, and a4 , translation by t1 and t2 . Here, the shifts were chosen to solely include translation, which means for the astrometric corrections the values for t1 and t2 were determined for each observation relative to observation 1912 and are displayed in Fig. 1. The parameters are calculated in units of physical pixels and converted to arcsec by multiplication with 0.13 arcsec, the pixel coverage of the HRC-I detector. From Fig. 1 it is evident that 10 of the correction parameters exceed Chandra’s pointing accuracy of 0.4 arcsec, belonging to 9 observations in total as for one observation this is the case for both t1 and t2 . The mean root mean square (RMS) scatter for the absolute shifts in x and y direction combined amounts to 0.67 arcsec, which is an estimate for the uncertainty of the shifts. When looking at the detected sources in the observations with an offset higher than 0.4 arcsec, there is no obvious reason for the shift compared to the observations with values below the threshold value, so the offsets relative to observation 1912 were applied to all 44 observations, using the CIAO tool ‘wcs_update’. The following analysis steps were then performed with all 45 observations. Additionally, to obtain an estimate for the absolute astrometry, wavdetect was run on a merged image of the entire HRC-I field of view, which was created from the corrected level=2 event files (see Sect. 2.2) with a bin size of 8. The detected sources were then cross- matched3 with the sources listed in Table 1 in Kaaret (2002), which resulted in 130 matches with a mean angular distance of 0.43 ± 0.04 arcsec.
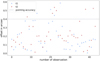 |
Fig. 1 Astrometric correction parameters t1 (blue crosses) and t2 (red pluses) in arcsec for all 44 observations relative to observations 1912. The dashed line marks the pointing accuracy of Chandra of 0.4 arcsec. |
2.2 Merged images and source flux
After applying astrometric corrections to the data, all 45 observations are effectively aligned so that merging them to obtain stacked images is possible. This was done using the CIAO script ‘merge_obs’. As an input, the tool requires the respective corrected level=2 event files and combines them, creating a single merged level=2 event file and exposure corrected images. The bin size in this case was set to 1, resulting in an unbinned image covering a box-shaped area of 180 × 180 sky-pixels centred close to the location of S And as determined by Fesen et al. (1999) (RA 00h42m42s.89 dec +41°16′05″.0). One sky-pixel corresponds to 0.13 arcsec. The mean off-axis angle of the source location amounts to around 10.9 ± 1.1 arcsec, with the highest off-axis angle being 36.6 arcsec in one of the 45 observations. As this is still fairly small, a noticeable effect on the PSF is not expected. The resulting image is displayed in Fig. 2. At the position of SNR1885 a faint source is visible in the image and could be detected with a significance of σ = 3.43. In order to obtain a value for the source flux, the count rate at the source location was determined first with the CIAO ‘srcflux’ script. The srcflux tool calculates net count rates and fluxes including uncertainties from the level=2 event files for a specified source location and region, background region, and energy band based on Bayesian statistics. If multiple files are given as input, the merged count rate is calculated automatically, provided that CIAO version 4.13 or newer is used.
The source region was defined as a circle enclosing 90% of Chandra’s PSF. This corresponds to a radius of roughly 0.83 arcsec (~3.1 pc at the adopted distance of 780 kpc to M31). As background region, a partial annulus with an inner radius of two times that of the source region (~1.7 arcsec) and an outer radius of six times the radius of the source region (~5.0 arcsec) is assumed. Both source and background regions are centred at the source position. In Fig. 2, the source region is indicated in red and the background in green. The energy band parameter was set to the full range of HRC-I (0.1–10 keV). Running srcflux with the listed input parameters results in the value given in the second column of Table 2.
To obtain the source flux, the count rate needs to be converted to units of erg cm−2 s−1. This was done using WebPIMMS4, an online mission count rate simulator provided by NASA’s High Energy Astrophysics Science Archive Research Centre (HEASARC) for that purpose. The tool calculates the flux for a specified energy range and mission specific detector, in this case Chandra’s HRC-I, from the measured count rate, assuming a given source model. The energy range was set to 0.1–10 keV to match that of HRC-I and an astrophysical plasma emission code (APEC) model at a temperature of 1 keV and solar element abundances were assumed. The redshift was set to zero. To consider absorption by gas in the Milky Way, the Galactic column density at the position of M31 was adopted, which amounts to 7 × 1020cm−2 (Sasaki et al. 2012). As SNR1885 is located in the central region of the Andromeda Galaxy, where the density is assumed to be high, absorption by the gas in M31 is also expected, which is taken into account by setting the intrinsic column density to 1 × 1021 cm−2 as was also done by Sasaki et al. (2012) for estimating the luminosity. The resulting flux value is displayed in the third column of Table 2. Additionally, the corresponding X-ray luminosity for the flux value in Table 2 was calculated to compare the luminosity to that of other SNRs. We assume a distance of d = 780 kpc to M31 (Bhardwaj et al. 2016). The resulting value is given in the fourth column of Table 2. We also note that another X-ray source close to the position of S And was detected, marked with a dark green cross in Fig. 2. This is not surprising, as this source had been identified for the first time by Kaaret (2002) whose observation (ObsID 1912) was included in the 45 data sets processed in this work. The source was listed as CXOM31 J004243.1+411604 and positioned at RA 00h42m43s.11 dec +41°16′04″.2. The measured luminosity amounts to 2.9 × 1036 erg cm−2 s−1 (Kaaret 2002). The comparison of the X-ray data to HST images showing the optical absorption feature of SNR1885 led Kaaret (2002) to the conclusion that the source is not the X-ray counterpart to SNR1885, as the angular distance to the centre of the absorption feature seems to be about 1.3 arcsec. Further examination of HST observations revealed a bright point source within 0.15 arcsec of the position of the X-ray source. Based on the estimated flux of 3.5 × 10⁻¹⁶erg cm−2s−1Å−1 obtained by analysing the HST observations, Kaaret (2002) suggested the source to be an optical nova. Hofmann et al. (2013) published a catalogue of X-ray sources in the central region of M31. The catalogue is based on the analysis of Chandra HRC-I data, also including the observation discussed in Kaaret (2002). The X-ray source was classified as a classical nova here as well.
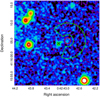 |
Fig. 2 Merged unbinned image of the region around the reported position of S And created from 45 Chandra HRC-I data sets. One pixel corresponds to 0.13 arcsec. The red circle indicates the source region (r = 0.83 arcsec) and the green annulus the background region (rinner ≈ 1.7 arcsec, router ≈ 5.0 arcsec) used to calculate the X-ray source flux in the 0.1–10 keV band. The dark green cross marks the position of the X- ray source reported by Kaaret (2002) identified as an optical nova and was excluded from the background region. |
Calculated values for count rate, source flux, and luminosity at the position of SNR 1885A in the 0.1–10 keV band.
3 Discussion
In order to contextualise the obtained X-ray source flux of SNR1885, it will now be compared to the X-ray fluxes of some other known SNe and SNRs in the Milky Way and nearby galaxies as well as to theoretical predictions regarding the expected X-ray luminosity.
3.1 Comparison of SNR1885 to other known SNRs
Figure 3 shows the X-ray luminosities in the 0.3–8 keV band of some of the known younger Galactic remnants (type I and type II respectively) along with the obtained luminosity of SNR1885 (see Table 2). Additionally, the plot contains the reconstructed X-ray light curves of four of the oldest known X-ray SNe, SN1970G, SN1968D, SN1957D, and SN1941 in the same manner as presented by Ramakrishnan & Dwarkadas (2020) in their figure 16. The plotted luminosities and ages of the younger Galactic remnants are given in Table 3, for the X-ray SNe see Ramakrishnan & Dwarkadas (2020). In their publication Ramakrishnan & Dwarkadas (2020) presented a study of the evolution of the oldest known X-ray core-collapse SNe by reconstructing their light curves over a few decades and drew comparisons to the X-ray emission of known young Galactic SNRs with ages of up to over two thousand years. We added the luminosity of SNR1885 obtained from merging all 45 HRC- I observations (see Table 2) to the original plot, as well as two power law fits that will be discussed in detail in Sect. 3.2. Evidently, the X-ray luminosities of most of the Galactic remnants as well as of the four X-ray SNe exceed the obtained luminosity of SNR1885 by two to three orders of magnitude, although the value lies within the error range of two data points from SN1970G and SN1968D. Exceptions are the remnant of the type II-supernova SN1181 and the remnants of SN1006 and G1.9 + 0.3, both classified as type la. Generally, the luminosity seems to initially decrease with time, which matches the analysis results by Ramakrishnan & Dwarkadas (2020). The luminosities of G1.9 + 0.3 and SNR1885 fit into this decreasing pattern. In contrast, the luminosities of the younger Galactic remnants rise with time.
When SNR1885 is compared to fluxes of other SNRs in M31, one finds that the obtained flux is by at least two orders of magnitude lower than the luminosities of other remnants. Sasaki et al. (2012) presented a study of SNRs in M31 detected by the X-ray Multi-Mirror Mission (XMM-Newton) in 2012. In total, 26 X-ray sources were classified as SNRs and catalogued. The determined luminosities in the 0.35–2.0 keV band range from 2.1 × 1035 erg s−1 to 3.1 × 1036 erg s−1, so two to three orders of magnitude higher than that of SNR1885, which is quite similar to the comparison to the younger Galactic remnants.
One possible explanation for the lack of X-ray emission from SNR1885 compared to the other SNRs is absorption. G1.9+0.3 is with an age of 100 yr the youngest known Galactic SNR. Its measured X-ray luminosity is comparable to SNR1885. G1.9+0.3 is located at a distance of approximately 8.5 kpc near the Galactic centre, where absorption is relatively high (absorbing column density of 5.5 × 1022 cm−2), accounting for a lower detected luminosity (Reynolds et al. 2008). The SNR1885 and G1.9+0.3 are with 127 and 100 yr fairly close in age. If SNR1885 is placed close to the centre of M31, strong absorption would be a valid reason for the lack of X-ray emission from SNR1885, much like it is the case for G1.9+0.3.
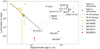 |
Fig. 3 X-ray luminosities of the oldest known X-ray SNe and some younger Galactic remnants. The original plot is from Ramakrishnan & Dwarkadas (2020). The X-ray luminosity of SNR1885 was added to the plot, as well as the two fits for ED phase (dark grey) and ST phase (light grey) using Eqs. (3) and (5). The dashed lines mark the error ranges of the parameter L01/02 determined by the fit. |
3.2 Theoretical predictions on the X-ray luminosity of SNRs
Having compared the obtained X-ray luminosity of SNR1885 to other SNRs, it is now necessary to understand whether the result is in agreement with theoretical predictions. Therefore, the derivation of the theoretically expected X-ray luminosity of SNRs in their different evolutionary stages is briefly outlined in the following. The evolution of SNRs is generally divided into three different stages, in which the SNR is observable, that is, the ejecta-dominated (ED) free expansion phase, Sedov-Taylor (ST) phase with adiabatic expansion, and the radiative phase. As SNR1885 is a rather young remnant, mainly the first two phases are of interest in this work. A theoretical description of these phases along with calculations of the relevant parameters was presented by Truelove & McKee (1999).
According to Ramakrishnan & Dwarkadas (2020), the thermal X-ray emission LX from a SNR is generally given by
 (2)
(2)
In this case, Λ is the cooling function of the medium into which the shock is propagating, ne is the electron density of the medium and V the volume of the emitting region. Chevalier (1982) presented a self-similar solution for the uniform expansion of gas into a stationary surrounding medium under the assumption that the ejecta and the circumstellar medium (CSM) have power law density profiles with indices n and s, respectively. The index n for the ejecta density usually lies in the range 9 < n < 11 for stellar envelopes (Matzner & McKee 1999), while s for the density of the CSM is dependent on the stellar wind of the progenitor. A steady wind corresponds to s = 2. The self-similar solution only holds for power law indices n > 5 and s < 3. Following Eq. (2), the evolution of the X-ray luminosity can be derived, as was presented by Ramakrishnan & Dwarkadas (2020):
![Mathematical equation: $\eqalign{ & {L_{\rm{X}}} = {L_0}{t^{ - [(2s - 3)n + 6.12 - 5.04s]/(n - s)}}\quad {\rm{ for}}\,\,{\rm{ }}{T_{\rm{e}}} \le 2.24{\rm{keV}}, \cr & {L_{\rm{X}}} = {L_0}{t^{ - [(2s - 3)n + 12 - 7s]/(n - s)}}\quad \,\,\,\,\,\,{\rm{ for}}\,{\rm{ }}{T_{\rm{e}}} > 2.24{\rm{keV}}. \cr} $](/articles/aa/full_html/2025/01/aa50152-24/aa50152-24-eq8.png) (3)
(3)
Here, L0 is a proportionality factor with dimension erg s−1. The distinction by Te in Eq. (3) results from the form of the cooling function Λ, which depends on the electron temperature Te (Chevalier & Fransson 2017). In the ST phase, the reverse shock reaches the centre of the SNR and only the forward shock remains and propagates further into the interstellar medium (ISM). The CSM-density according to the self-similar solution can be expressed, following Ramakrishnan & Dwarkadas (2020), as
 (4)
(4)
The electron temperature Te at this point can assumed to be below 2.24 keV. Consequently, the X-ray luminosity in the ST phase evolves as
 (5)
(5)
still following Ramakrishnan & Dwarkadas (2020). The factor L0 is again a proportionality constant with the dimension erg s−1 . Generally, the luminosity decreases during the ED phase and increases after transition to the ST phase (Ramakrishnan & Dwarkadas 2020).
Subsequently, the theoretical considerations are largely consistent with the data depicted in Fig. 3, if it is assumed that most of the younger remnants have begun transitioning to the ST phase. This assumption is rather realistic, if one takes a look at research results on some of the younger remnants. For example, extensive observations of Tycho’s SNR with Chandra and XMM- Newton have revealed the distribution of the shocked matter and the exact positions of forward shock, reverse shock, and contact discontinuity could be determined. Model calculations show that the ejecta are no longer expanding freely and the remnant has started transitioning into the ST phase (Seward & Charles 2010).
3.3 Comparison of SNR1885 to the theoretically expected flux
To further investigate the correlation of the theoretical predictions to the actual luminosities, especially with regard to the obtained value for SNR1885, Eq. (3) was used to fit the data of the X-ray SNe SN1957D, SN1968D, and SN1970G in Fig.3, including the remnant of the type Ia-SN G1.9+0.3 and SNR1885. The SN1941C was left out, as there is only data from one observation available (Ramakrishnan & Dwarkadas 2020). To match the decline of the plotted luminosities, an index s close to s = 3 had to be selected. For a steady wind (s = 2), the slope was not steep enough to describe the actual data, therefore, the index was set to s = 2.99 (see also Fig. 4). This implies that the density of the CSM decreases more rapidly than would be the case for a steady wind. If these values for n and s are inserted into Eq. (3), we obtain
 (6)
(6)
Equation (6) was then fitted to the data, resulting in a fit parameter of L01 = (4.30 ± 0.29) × 1041 erg s−1 (ED phase).
Although the theory does predict the X-ray luminosity to initially decrease, both G1.9+0.3 and SNR1885 are still fainter than indicated by the fit, which suggests that once the X-ray SNe have reached the age of SN1885A, their luminosities will be at least one to two orders of magnitude higher than the current luminosity of SNR1885. However, the SNe discussed in Ramakrishnan & Dwarkadas (2020) were classified as type II, while S And is believed to have been a type Ia-SN (see Sect. 1). This may account for differences in the in the evolution of LX.
Equation (5) was used to fit the data of the Galactic remnants in Fig. 3. Merely SN1006 and SN1181 were excluded from the fit. G1.9+0.3 was also left out, as it was already included in the previous fit. Here, the index s was set to s = 0, as the forward shock is now expected to propagate into ISM with a constant density (Ramakrishnan & Dwarkadas 2020). Inserting the parameters into Eq. (5) results in
 (7)
(7)
Equation (7) was then fitted to the data. The resulting fit parameter is given by L02 = (1.4 ± 0.8) × 1031 erg s−1 (ST phase).
The qualitative evolution of LX over time is displayed in Fig. 4 for s = 2 and n = 10 in the ED phase according to Eq. (3) and in Fig. 5 for s = 0 in the ST phase according to Eq. (5). Additionally, the data from Fig. 3 have been over-plotted to better illustrate, which of the data were used for the respective fits for ED and ST phase. In Fig. 4, Lx is shown for a steady wind of the progenitor star to showcase that s = 2 is too small to match the steep decline of the data. The normalisation parameter L0 in this case was estimated from fitting Eq. (3) to the first eight data points, where the decline is less steep. Moreover, because of the above mentioned steeper decline of the data towards the end of the ED phase, a broken power law of the form
 (8)
(8)
was fitted to the data shown in Fig. 4. The power law index α1 in this case was fixed to α1 = −1, which corresponds to s = 2 and n = 10 in Eq. (3). The index α2 for the second power law, the break timescale and the proportionality factor C were determined by the fit and result in α2 = −6.4 ± 2.7, tbreak = 39.9 ± 2.5 yr, and C = (7.3 ± 0.6) × 1038 erg s−1. It has to be noted that α2 = −6.4 ± 27 would indicate an index s of around 5 to 6 in Eq. (3), which exceeds the limit s < 3 dictated by the self-similar solution. In Fig. 5, L0 = L02, obtained from the fit in Fig. 3, was adopted to show the theoretical evolution of LX . Evidently, in this case the data agree with the theoretical predictions. The only exceptions are the remnants of SN1006 and SN1181, which are distinctly fainter than the rest of the Galactic remnants. The reason is the position of the remnants within the Galaxy. The SN1006 is located about 15° above the Galactic plane (Seward & Charles 2010), which means the density of the surrounding medium is fairly low. The forward shock is bound to eventually run out of matter to sweep up, which in turn results in a lower X-ray luminosity. The same reasoning can be applied to SN1181 (Ramakrishnan & Dwarkadas 2020) and could also be true for SNR1885 if it was located in the halo outside of the galactic plane of M31. Then the density of the surrounding medium swept up by the forward shock would be very low, which reduces the X-ray emission much like for the remnants of SN1006 or SN1181, both of which were excluded from the fit for the above stated reason.
The fits show that one can assume that the evolution of SNR1885 is still largely dominated by the ejecta and the remnant has not yet fully transitioned to the ST phase, which could explain why it is not strongly emitting in X-rays. This is also in agreement with optical observations, stating that the ejecta are expanding freely (see Sect. 1). There is a possibility that as soon as SNR1885 transitions into the ST phase, the X-ray emission will increase to a point where the remnant will be well visible in X-rays. However, as stated in Sect. 3.1, if SNR1885 is located close to the centre of M31, strong absorption by the surrounding medium would also reduce X-ray emission, much as is the case for G1.9+0.3 located near the Galactic centre. When comparing SNR1885 and G1.9+0.3, one finds that those are the only two remnants at the end of the ED phase and as already mentioned above, both objects are considerably fainter in X-rays than predicted by theory in the ED phase (see Fig. 3). This might indicate that the X-ray luminosity declines at a higher rate than implied by the fit in the second half of the ED phase, implying that the X-ray luminosity might in fact follow a broken power law.
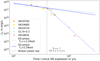 |
Fig. 4 Evolution of LX over the time t since the SN explosion according to Eq. (3) with L0 = (2.9 ± 0.4) × 1038 erg s−1 (Te ≤ 2.24 keV) and L0 = (6.9 ± 0.7) × 1038 erg s−1 (Te > 2.24keV), assuming s = 2 and n = 10. The data used for the fit in the ED phase in Fig. 3 were over-plotted. Evidently, a power law index of s = 2 is not sufficient to describe the steep decline of the data. The parameter L0 in each case was estimated by fitting Eq. (3) to the first eight data points (solid markers), where the decline is lower compared to the rest of the data. Additionally, a broken power law (blue dashed line) was fitted according to Eq. (8), assuming α1 = −1, to all data points (solid and transparent markers) to better describe the steep decline of the data towards the end of the ED phase. From the fit we obtain tbreak = 39.9 ± 2.5 yr. |
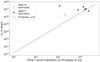 |
Fig. 5 Evolution of LX over the time t since the transition to the ST phase according to Eq. (5) with L0 = L02. The data used for the fit in the ST phase in Fig. 3 were over-plotted. |
4 Conclusions
In this work, a faint X-ray source at the reported position of SNR1885 was detected by combining a total of 45 Chandra HRC-I observations. After applying astrometric corrections to the data, a merged image was created using all 45 observations. The X-ray source flux of SNR1885 was calculated resulting in a value of  erg cm−2 s−1 in the 0.1–10 keV band. This corresponds to an X-ray luminosity of
  assuming a distance of 780 kpc to M31.
Comparison of the obtained X-ray luminosity of SNR1885 from combining all 45 observations to the measured X-ray luminosities of known Galactic remnants shows that the value is almost two orders of magnitude lower. The same result is found when comparing it to the luminosities of SNRs in M31 determined by Sasaki et al. (2012). Nevertheless, the obtained luminosity of SNR1885 is in agreement with theoretical predictions, if one assumes that the remnant is still in the ED phase, where the X-ray emission is initially expected to decline (Ramakrishnan & Dwarkadas 2020). It is possible that as SNR1885 begins to transition to the ST phase, X-ray emission will rise similar to those of the examined Galactic remnants. Moreover, if SNR1885 is located near the galactic centre of M31, strong absorption could be a reason for the low X-ray emission. Another possibility is that SNR1885 is located in the halo of M31, where the ISM density is low. This means the shock would eventually run out of material to sweep up, which would result in lower X-ray emission. Additionally, it was found that the X-ray luminosity might decrease faster towards the end of the ED phase compared to the beginning, following a broken power law with a break timescale of tbreak = 39.9 ± 2.5yr.
All in all, further observations are necessary to show how SNR1885 evolves. If the X-ray emission indeed rises, new insights on the evolution of young SNRs and specifically on the end of the ED phase and the beginning of the transition to the ST phase will be gained from new observations. Furthermore, valuable information with regard to the classification of S And and about the type I-SNe in general can be revealed. What remains to say is that S And, at the time of its discovery by Hartwig as well as now, remains ‘[one of] the most fascinating event[s] of modern astronomy’ (Jones 1976).
Acknowledgements
The scientific results reported in this article are based on data obtained from the Chandra Data Archive. This research has made use of software provided by the Chandra X-ray Center (CXC) in the application packages CIAO.
References
- Bhardwaj, A., Kanbur, S. M., Macri, L. M., et al. 2016, AJ, 151, 88 [NASA ADS] [CrossRef] [Google Scholar]
- Chevalier, R. A. 1982, ApJ, 258, 790 [NASA ADS] [CrossRef] [Google Scholar]
- Chevalier, R. A., & Fransson, C. 2017, in Handbook of Supernovae, eds. A. W. Alsabti, & P. Murdin (Cham: Springer International Publishing), 875 [CrossRef] [Google Scholar]
- Chevalier, R. A., & Plait, P. C. 1988, ApJ, 331, L109 [NASA ADS] [CrossRef] [Google Scholar]
- de Vaucouleurs, G., & Corwin, H. G., J. 1985, ApJ, 295, 287 [NASA ADS] [CrossRef] [Google Scholar]
- Dickel, J. R., & Dodorico, S. 1984, MNRAS, 206, 351 [NASA ADS] [CrossRef] [Google Scholar]
- Fesen, R. A., Hamilton, A. J. S., & Saken, J. M. 1989, ApJ, 341, L55 [NASA ADS] [CrossRef] [Google Scholar]
- Fesen, R. A., Gerardy, C. L., McLin, K. M., & Hamilton, A. J. S. 1999, ApJ, 514, 195 [NASA ADS] [CrossRef] [Google Scholar]
- Fesen, R. A., Höflich, P. A., Hamilton, A. J. S., et al. 2007, ApJ, 658, 396 [NASA ADS] [CrossRef] [Google Scholar]
- Gaposchkin, C. P. 1936, ApJ, 83, 245 [NASA ADS] [CrossRef] [Google Scholar]
- Graham, J. R. 1988, ApJ, 326, L51 [NASA ADS] [CrossRef] [Google Scholar]
- Greafe, C., Wilms, J., & Heber, U. 2015, in Nuncius Hamburgensis – Beiträge zur Geschichte der Naturwissenschaften, 31, Astronomie in Franken, ed. G. Wolfschmidt (Hamburg: tredition), 369 [Google Scholar]
- Hofmann, F., Pietsch, W., Henze, M., et al. 2013, A&A, 555, A65 [NASA ADS] [CrossRef] [EDP Sciences] [Google Scholar]
- Jones, K. G. 1976, J. Hist. Astron., 7, 27 [NASA ADS] [CrossRef] [Google Scholar]
- Kaaret, P. 2002, ApJ, 578, 114 [NASA ADS] [CrossRef] [Google Scholar]
- Matzner, C. D., & McKee, C. F. 1999, ApJ, 510, 379 [Google Scholar]
- Ramakrishnan, V., & Dwarkadas, V. V. 2020, ApJ, 901, 119 [Google Scholar]
- Reynolds, S. P., Borkowski, K. J., Green, D. A., et al. 2008, ApJ, 680, L41 [NASA ADS] [CrossRef] [Google Scholar]
- Sasaki, M., Pietsch, W., Haberl, F., et al. 2012, A&A, 544, A144 [NASA ADS] [CrossRef] [EDP Sciences] [Google Scholar]
- Seward, F. D., & Charles, P. A. 2010, in Exploring the X-ray Universe, 2nd edn. (Cambridge University Press), 97 [CrossRef] [Google Scholar]
- Truelove, J. K., & McKee, C. F. 1999, ApJS, 120, 299 [Google Scholar]
- van den Bergh, S. 2002, AJ, 123, 2045 [NASA ADS] [CrossRef] [Google Scholar]
- Weisskopf, M. C., Brinkman, B., Canizares, C., et al. 2002, PASP, 114, 1 [NASA ADS] [CrossRef] [Google Scholar]
All Tables
ObsIDs of all 45 Chandra HRC-I observations used for the data analysis in this work.
Calculated values for count rate, source flux, and luminosity at the position of SNR 1885A in the 0.1–10 keV band.
All Figures
|
Fig. 1 Astrometric correction parameters t1 (blue crosses) and t2 (red pluses) in arcsec for all 44 observations relative to observations 1912. The dashed line marks the pointing accuracy of Chandra of 0.4 arcsec. |
| In the text | |
|
Fig. 2 Merged unbinned image of the region around the reported position of S And created from 45 Chandra HRC-I data sets. One pixel corresponds to 0.13 arcsec. The red circle indicates the source region (r = 0.83 arcsec) and the green annulus the background region (rinner ≈ 1.7 arcsec, router ≈ 5.0 arcsec) used to calculate the X-ray source flux in the 0.1–10 keV band. The dark green cross marks the position of the X- ray source reported by Kaaret (2002) identified as an optical nova and was excluded from the background region. |
| In the text | |
|
Fig. 3 X-ray luminosities of the oldest known X-ray SNe and some younger Galactic remnants. The original plot is from Ramakrishnan & Dwarkadas (2020). The X-ray luminosity of SNR1885 was added to the plot, as well as the two fits for ED phase (dark grey) and ST phase (light grey) using Eqs. (3) and (5). The dashed lines mark the error ranges of the parameter L01/02 determined by the fit. |
| In the text | |
|
Fig. 4 Evolution of LX over the time t since the SN explosion according to Eq. (3) with L0 = (2.9 ± 0.4) × 1038 erg s−1 (Te ≤ 2.24 keV) and L0 = (6.9 ± 0.7) × 1038 erg s−1 (Te > 2.24keV), assuming s = 2 and n = 10. The data used for the fit in the ED phase in Fig. 3 were over-plotted. Evidently, a power law index of s = 2 is not sufficient to describe the steep decline of the data. The parameter L0 in each case was estimated by fitting Eq. (3) to the first eight data points (solid markers), where the decline is lower compared to the rest of the data. Additionally, a broken power law (blue dashed line) was fitted according to Eq. (8), assuming α1 = −1, to all data points (solid and transparent markers) to better describe the steep decline of the data towards the end of the ED phase. From the fit we obtain tbreak = 39.9 ± 2.5 yr. |
| In the text | |
|
Fig. 5 Evolution of LX over the time t since the transition to the ST phase according to Eq. (5) with L0 = L02. The data used for the fit in the ST phase in Fig. 3 were over-plotted. |
| In the text | |
Current usage metrics show cumulative count of Article Views (full-text article views including HTML views, PDF and ePub downloads, according to the available data) and Abstracts Views on Vision4Press platform.
Data correspond to usage on the plateform after 2015. The current usage metrics is available 48-96 hours after online publication and is updated daily on week days.
Initial download of the metrics may take a while.