Fig. 4
Download original image
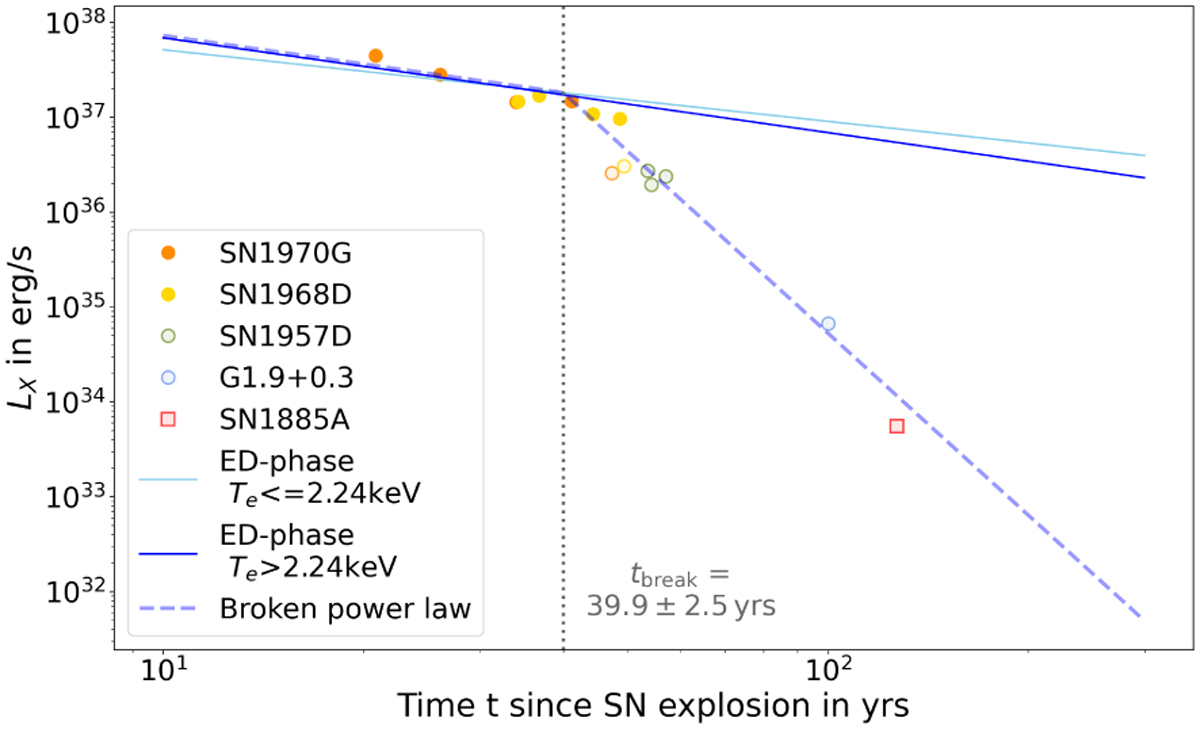
Evolution of LX over the time t since the SN explosion according to Eq. (3) with L0 = (2.9 ± 0.4) × 1038 erg s−1 (Te ≤ 2.24 keV) and L0 = (6.9 ± 0.7) × 1038 erg s−1 (Te > 2.24keV), assuming s = 2 and n = 10. The data used for the fit in the ED phase in Fig. 3 were over-plotted. Evidently, a power law index of s = 2 is not sufficient to describe the steep decline of the data. The parameter L0 in each case was estimated by fitting Eq. (3) to the first eight data points (solid markers), where the decline is lower compared to the rest of the data. Additionally, a broken power law (blue dashed line) was fitted according to Eq. (8), assuming α1 = −1, to all data points (solid and transparent markers) to better describe the steep decline of the data towards the end of the ED phase. From the fit we obtain tbreak = 39.9 ± 2.5 yr.
Current usage metrics show cumulative count of Article Views (full-text article views including HTML views, PDF and ePub downloads, according to the available data) and Abstracts Views on Vision4Press platform.
Data correspond to usage on the plateform after 2015. The current usage metrics is available 48-96 hours after online publication and is updated daily on week days.
Initial download of the metrics may take a while.