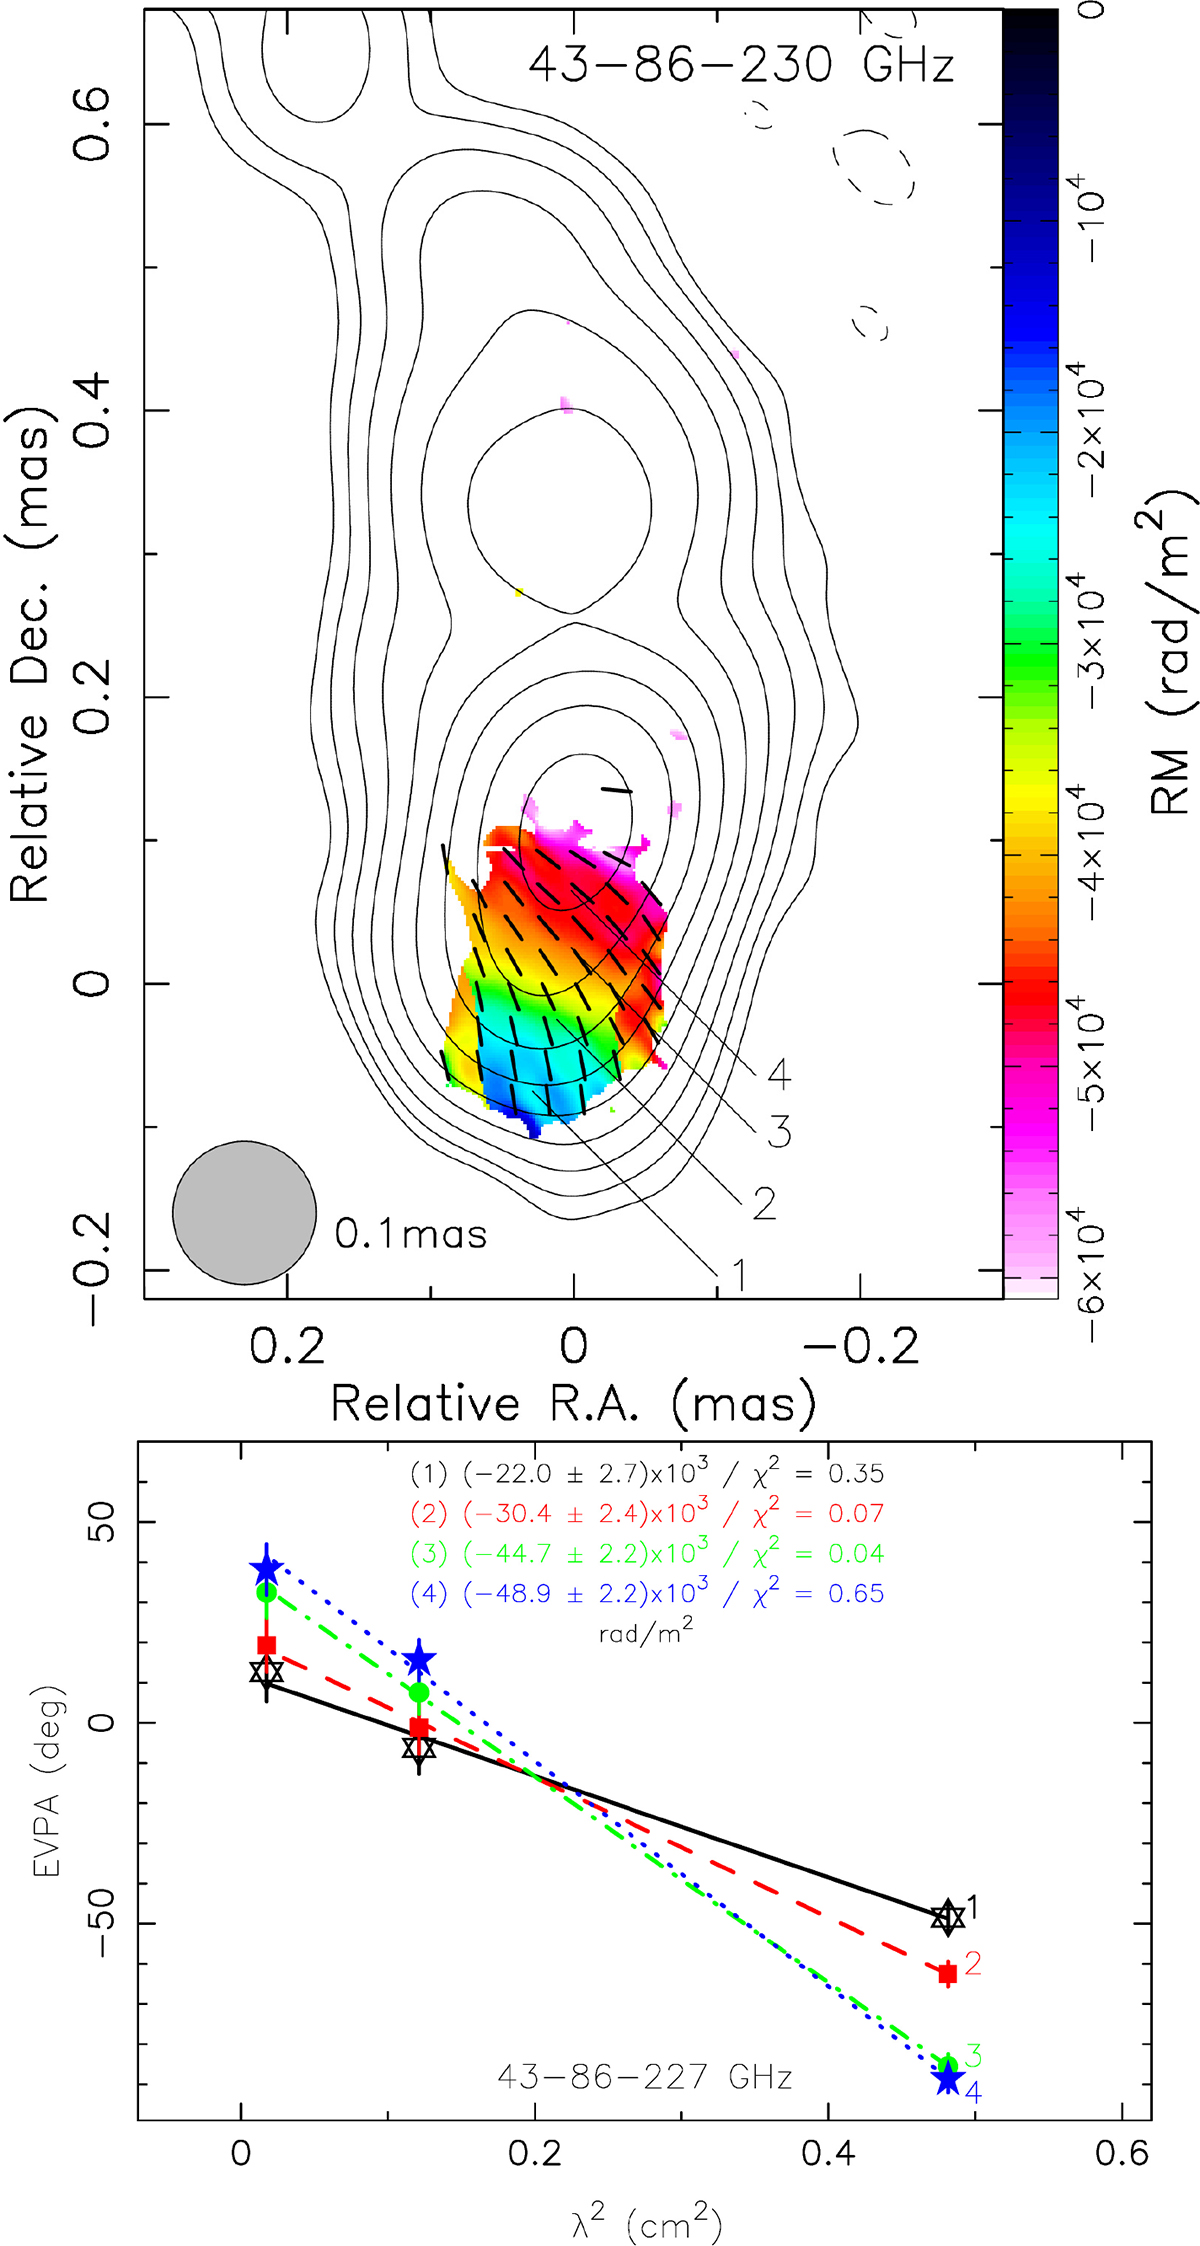
Fig. 8.
Download original image
Faraday RM at high frequencies. (Top panel) 43−227 GHz rotation measure map with 86 GHz total intensity contours at increasing powers of 2, lowest contour 3.34 mJy beam−1. Sticks denote linear polarization orientation at 86 GHz corrected for Faraday rotation. Numbers indicate locations where the EVPA(λ2) fits (bottom panel) are taken. Faraday rotation regression is shown by lines, and estimated values are given in rad m−1.
Current usage metrics show cumulative count of Article Views (full-text article views including HTML views, PDF and ePub downloads, according to the available data) and Abstracts Views on Vision4Press platform.
Data correspond to usage on the plateform after 2015. The current usage metrics is available 48-96 hours after online publication and is updated daily on week days.
Initial download of the metrics may take a while.