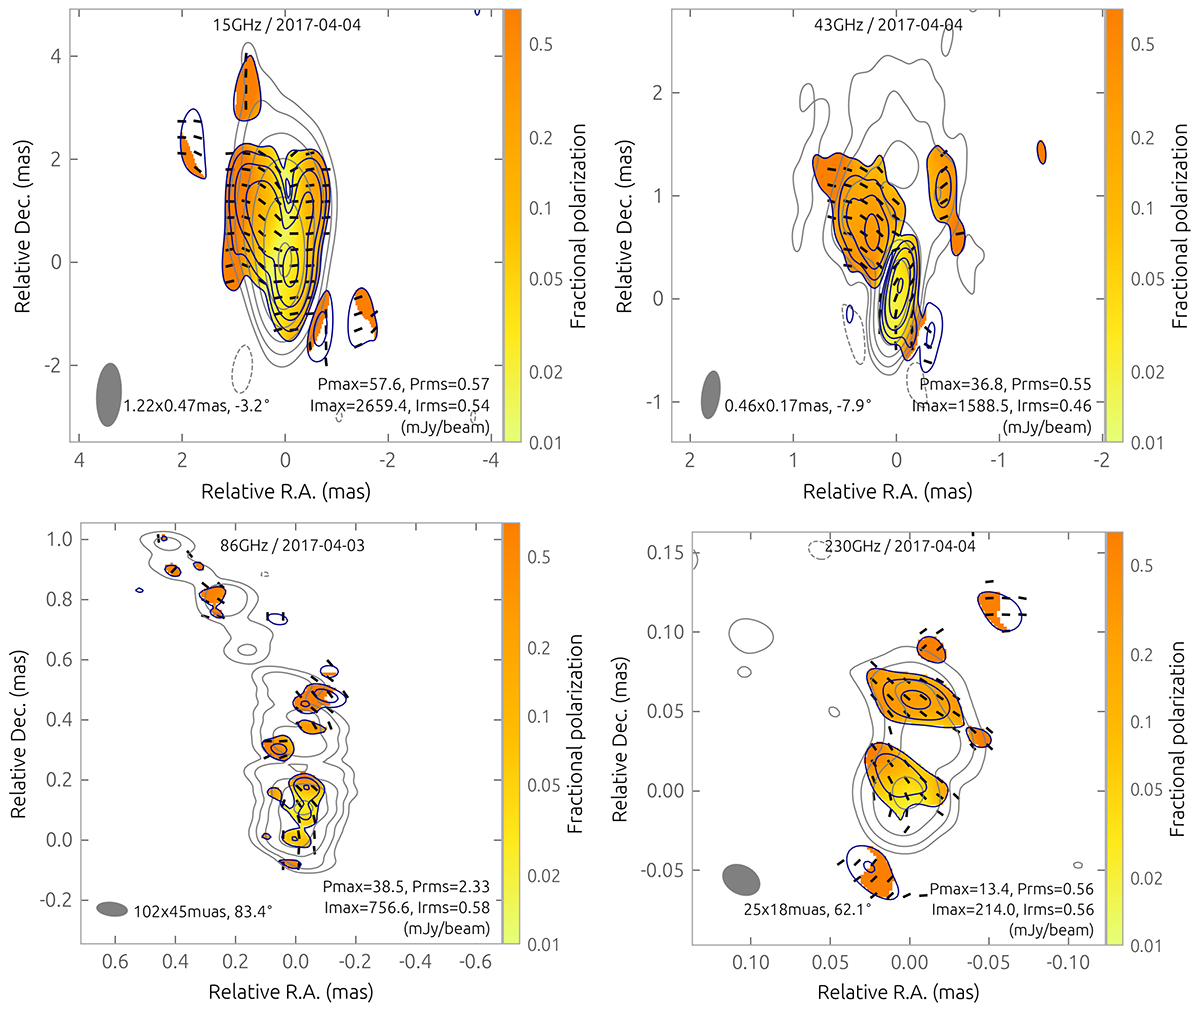
Fig. 6.
Download original image
Total intensity and linear polarization 15, 43, 86, and 227 GHz CLEAN images. Color denotes the distribution of the fractional linear polarization overlaid with the sticks indicating the electric polarization vector directions, not corrected for Faraday rotation. A synthesized beam is shown by a shaded ellipse in the lower left corner and its size is given. The Stokes I contours are plotted at increasing powers of 4, starting from the corresponding 3 rms level. The P contours are drawn at a 4 rms level. Here, we plot interpolated 15 and 43 GHz images (see Sect. 2.6 for details). The original MOJAVE and BU-BLAZAR images are given in Appendix B.
Current usage metrics show cumulative count of Article Views (full-text article views including HTML views, PDF and ePub downloads, according to the available data) and Abstracts Views on Vision4Press platform.
Data correspond to usage on the plateform after 2015. The current usage metrics is available 48-96 hours after online publication and is updated daily on week days.
Initial download of the metrics may take a while.