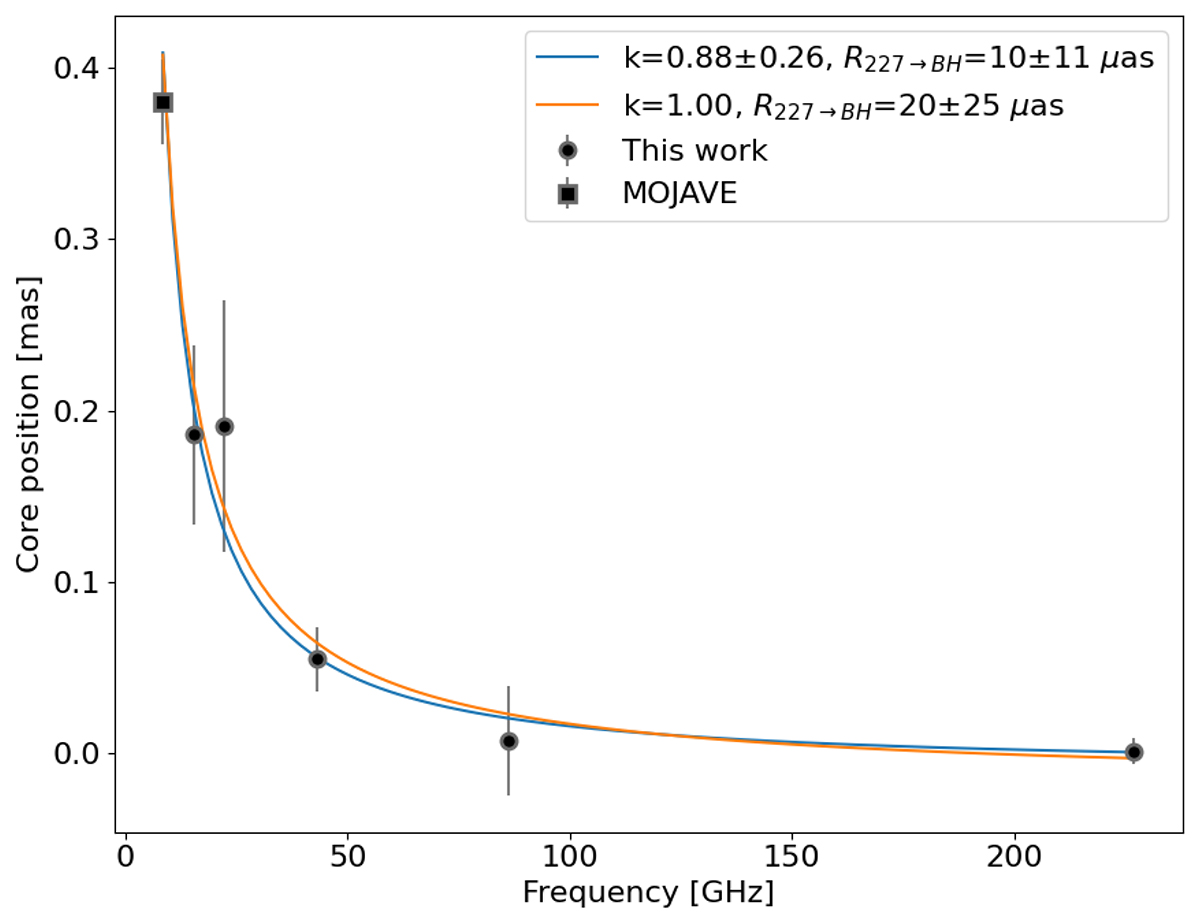
Fig. 2.
Download original image
Apparent core position as a function of frequency. Circles represent data from this research. The measurement at 8 GHz (square) was taken from Pushkarev et al. (2012) and was not used in the fit. The blue curve indicates the best fit of the form r = aν−1/kr + b using 227 GHz as the reference frequency. The orange curve represents the fit adopting the power law index kr = 1. The error bars include component position uncertainty as well as interpolation uncertainty at 15 and 43 GHz. R227 → BH is the angular distance between the 227 GHz core and the central BH.
Current usage metrics show cumulative count of Article Views (full-text article views including HTML views, PDF and ePub downloads, according to the available data) and Abstracts Views on Vision4Press platform.
Data correspond to usage on the plateform after 2015. The current usage metrics is available 48-96 hours after online publication and is updated daily on week days.
Initial download of the metrics may take a while.