Open Access
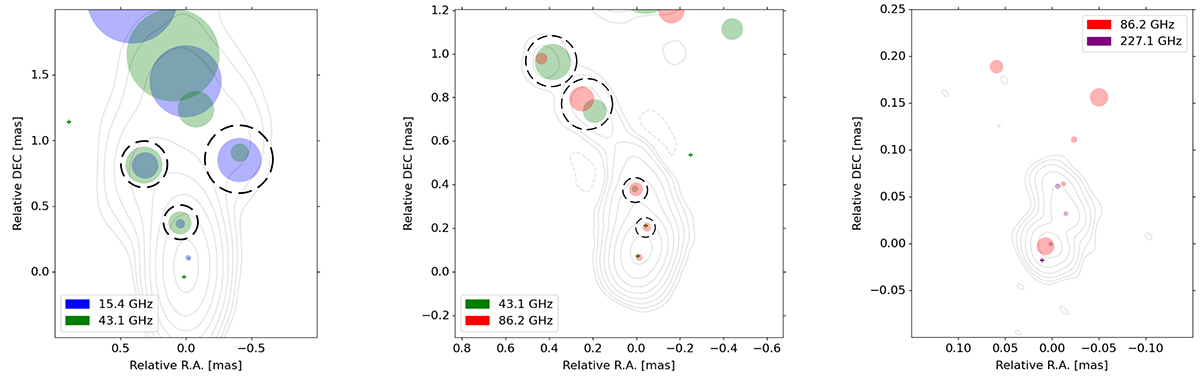
Fig. A.1.
Download original image
Pairwise image alignment based on same-UV-range modelfit models. Dash-line circles indicate the pairs of cross-identified components that were used to derive the image shift. Left to right: 15-43 GHz. 43-86 GHz, and 86-227 GHz. In each image, contours represent total intensity at the higher frequency.
Current usage metrics show cumulative count of Article Views (full-text article views including HTML views, PDF and ePub downloads, according to the available data) and Abstracts Views on Vision4Press platform.
Data correspond to usage on the plateform after 2015. The current usage metrics is available 48-96 hours after online publication and is updated daily on week days.
Initial download of the metrics may take a while.