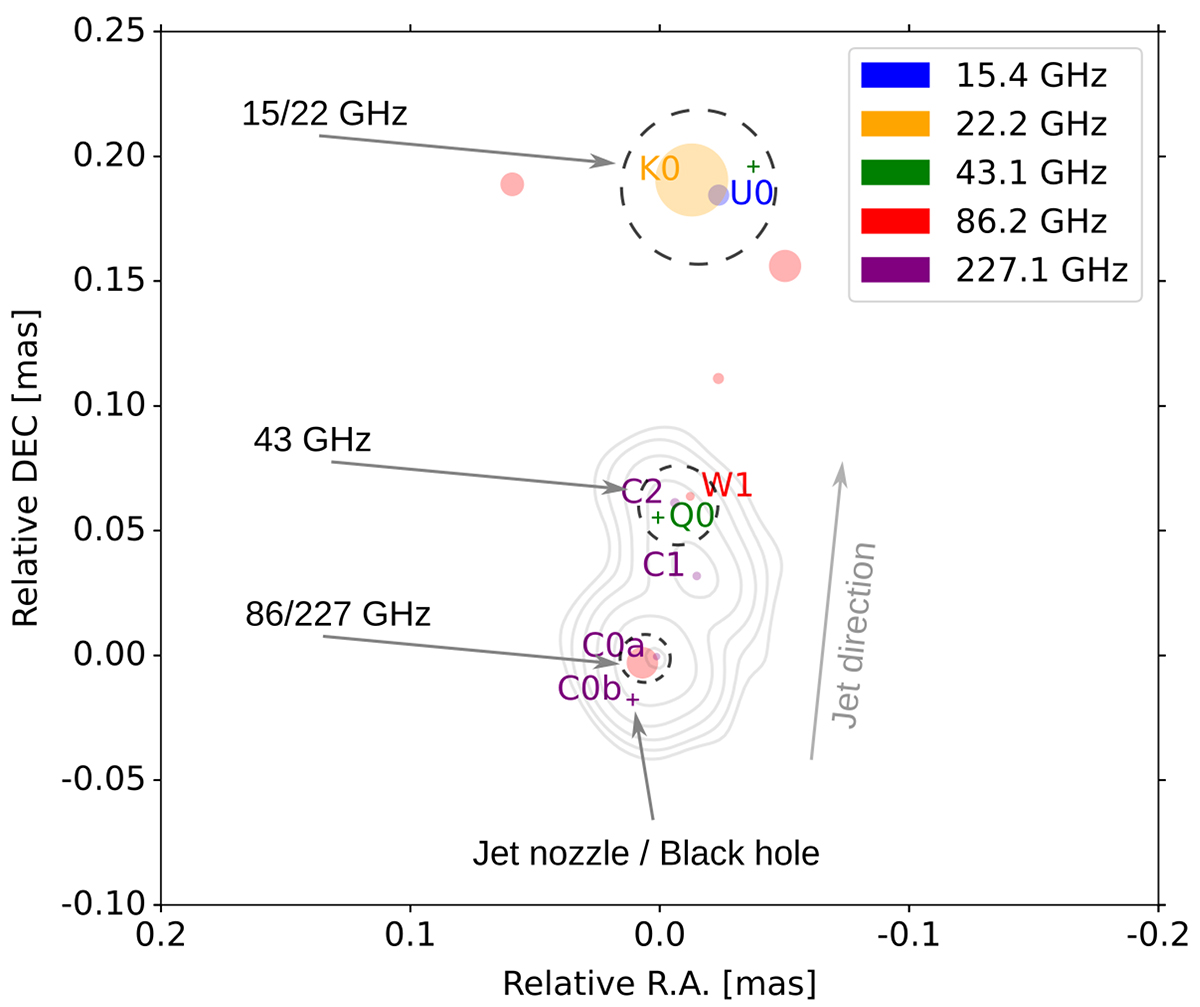
Fig. 11.
Download original image
Central region of NRAO 530. Contours represent total intensity at 227 GHz. Model components at 227 GHz are named according to Jorstad et al. (2023), at other frequencies – according to Table C.1. The size of Gaussian components is reduced by a factor of five with respect to Fig. 1 for visual clarity. Dashed circles show the location of the apparent VLBI core at different frequencies according to the labels. Component C2 spatially coincides with the apparent core of the 43 GHz model Q0 and an 86 GHz component W1. A weak component, C0b, spatially coincides with the true jet origin calculated using core shift.
Current usage metrics show cumulative count of Article Views (full-text article views including HTML views, PDF and ePub downloads, according to the available data) and Abstracts Views on Vision4Press platform.
Data correspond to usage on the plateform after 2015. The current usage metrics is available 48-96 hours after online publication and is updated daily on week days.
Initial download of the metrics may take a while.