Open Access
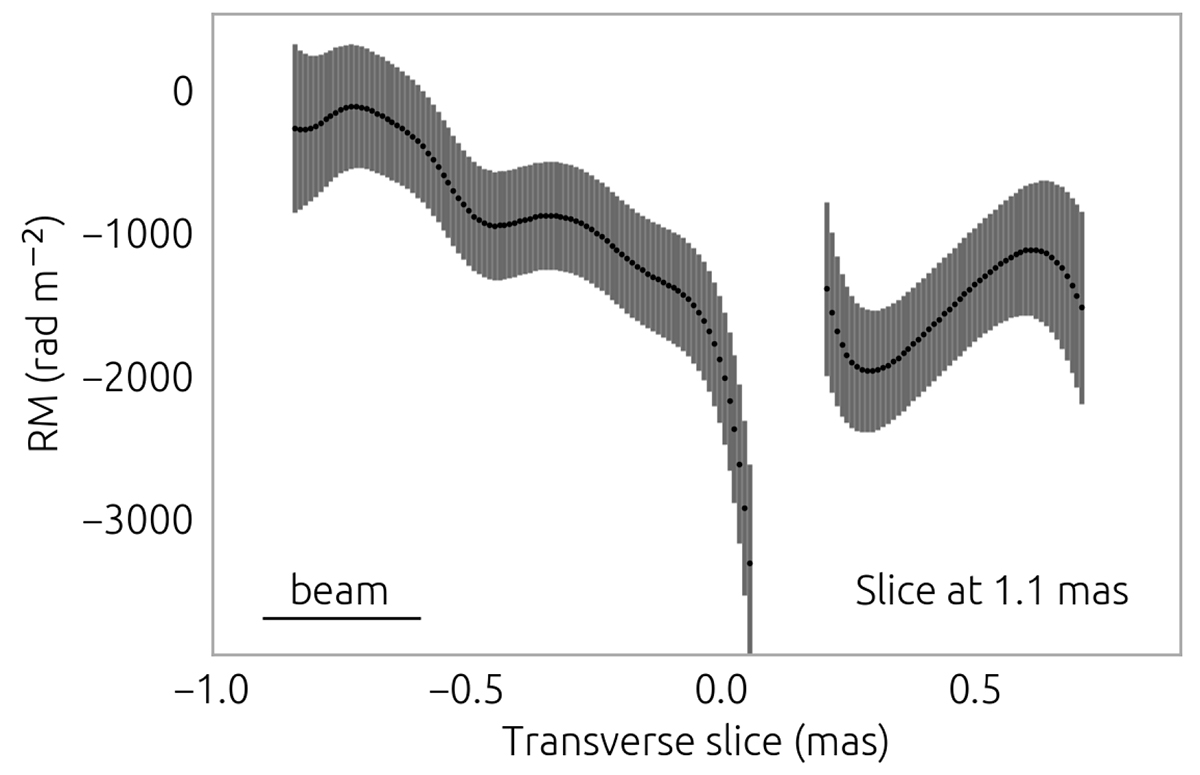
Fig. 10.
Download original image
Transverse slice taken across the RM map (Fig. 7) at 1.1 mas. The black dots show the RM fit at every pixel across the slice, with the gray area indicating the error in the fit for each point.
Current usage metrics show cumulative count of Article Views (full-text article views including HTML views, PDF and ePub downloads, according to the available data) and Abstracts Views on Vision4Press platform.
Data correspond to usage on the plateform after 2015. The current usage metrics is available 48-96 hours after online publication and is updated daily on week days.
Initial download of the metrics may take a while.