Fig. 1.
Download original image
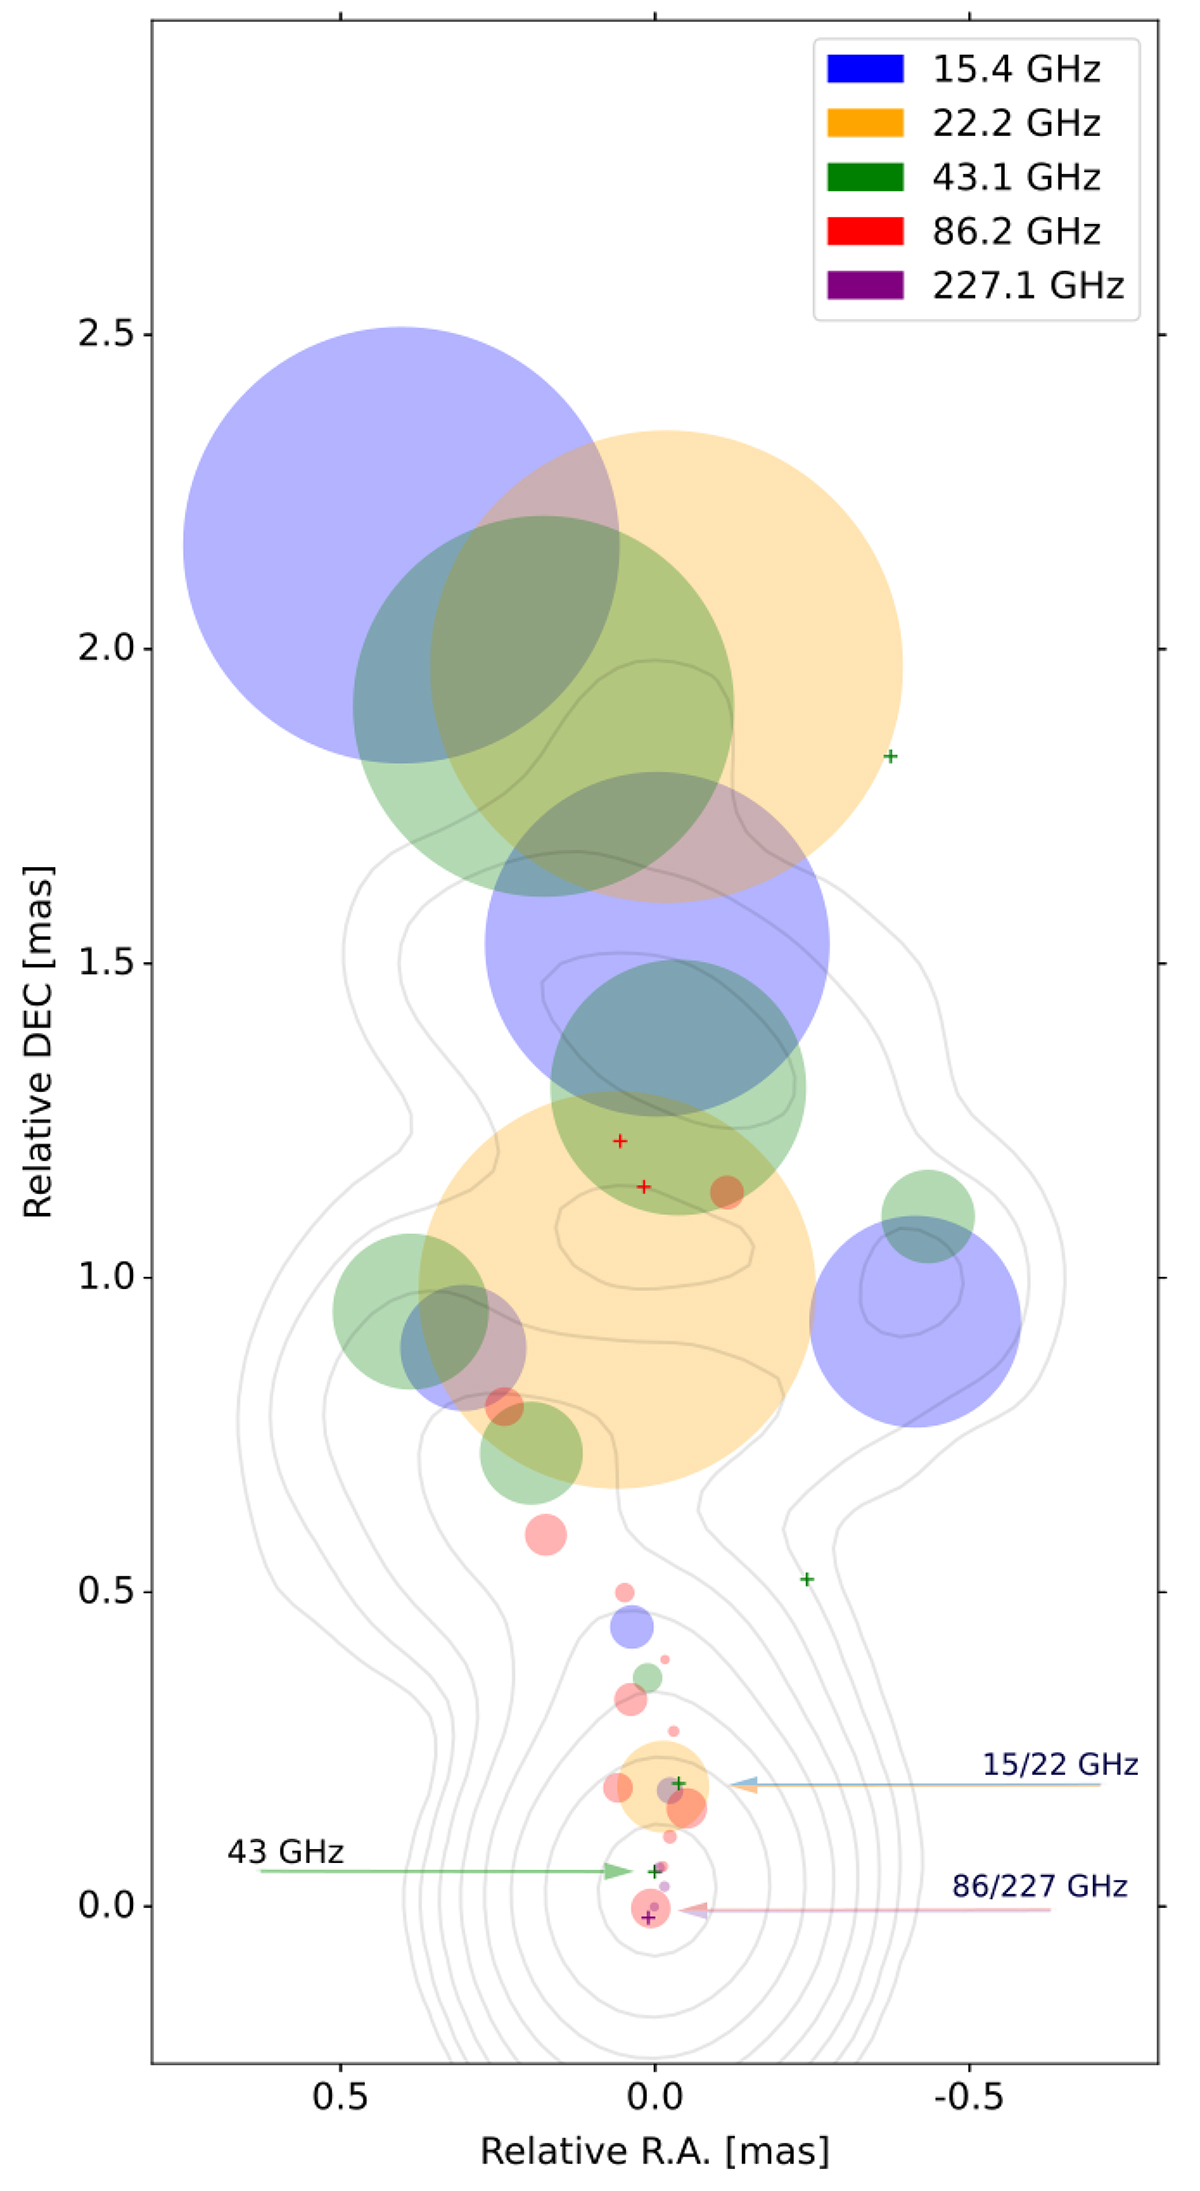
2D Gaussian best-fit models of NRAO 530 at five frequencies, after alignment. Each resolved Gaussian component is shown as a circle with a diameter of the FWHM of the component. Unresolved components are shown as crosses. Different colors correspond to different frequencies in the dataset, as is shown in the legend. Gray contours represent the source structure at 43 GHz convolved with a circular beam. Horizontal arrows indicate the position of the apparent jet beginning at 227 and 86 GHz, 43 GHz, and 15 and 22 GHz (bottom to top).
Current usage metrics show cumulative count of Article Views (full-text article views including HTML views, PDF and ePub downloads, according to the available data) and Abstracts Views on Vision4Press platform.
Data correspond to usage on the plateform after 2015. The current usage metrics is available 48-96 hours after online publication and is updated daily on week days.
Initial download of the metrics may take a while.