Open Access
Fig. 9
Download original image
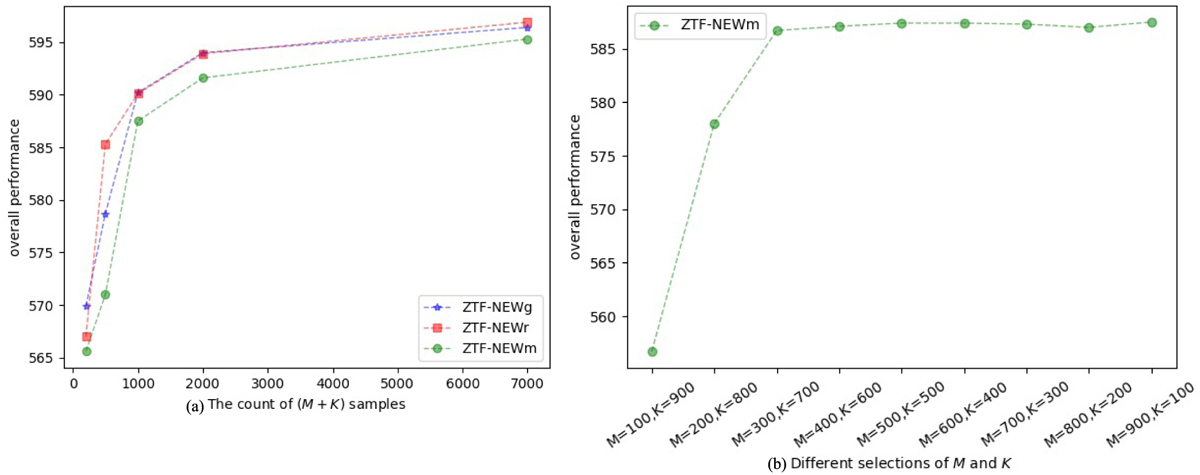
(a) Relationship between the quantity of labeled samples (M + K) and the overall performance. (b) Relationship between different selections of M and K and the overall results in the ZTF-NEWm. Figures (a) and (b) only display the mean value of the overall performance.
Current usage metrics show cumulative count of Article Views (full-text article views including HTML views, PDF and ePub downloads, according to the available data) and Abstracts Views on Vision4Press platform.
Data correspond to usage on the plateform after 2015. The current usage metrics is available 48-96 hours after online publication and is updated daily on week days.
Initial download of the metrics may take a while.