Fig. 4
Download original image
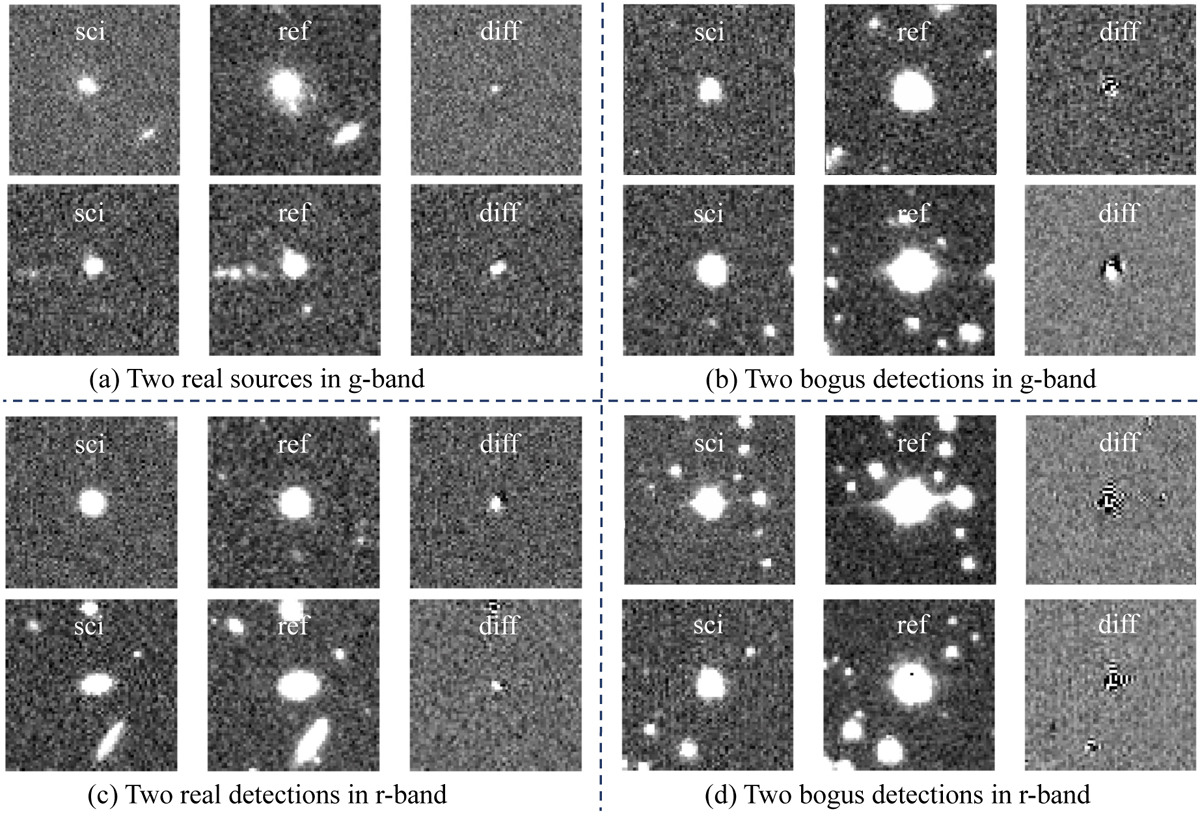
Examples of 63 pixels × 63 pixels triplet image stamps of our compiled datasets. The top-left part of the figure depicts two real sources in g-band and each row represents a real detection, showing the science image stamp, the reference image stamp, and the difference image stamp of the real detection from left to right respectively. Similarly, the bottom-left, top-right, and bottom-right of this figure display two real detections in the r-band, two bogus detections in the g-band, and two bogus detections in the r-band respectively.
Current usage metrics show cumulative count of Article Views (full-text article views including HTML views, PDF and ePub downloads, according to the available data) and Abstracts Views on Vision4Press platform.
Data correspond to usage on the plateform after 2015. The current usage metrics is available 48-96 hours after online publication and is updated daily on week days.
Initial download of the metrics may take a while.