Open Access
Fig. 10
Download original image
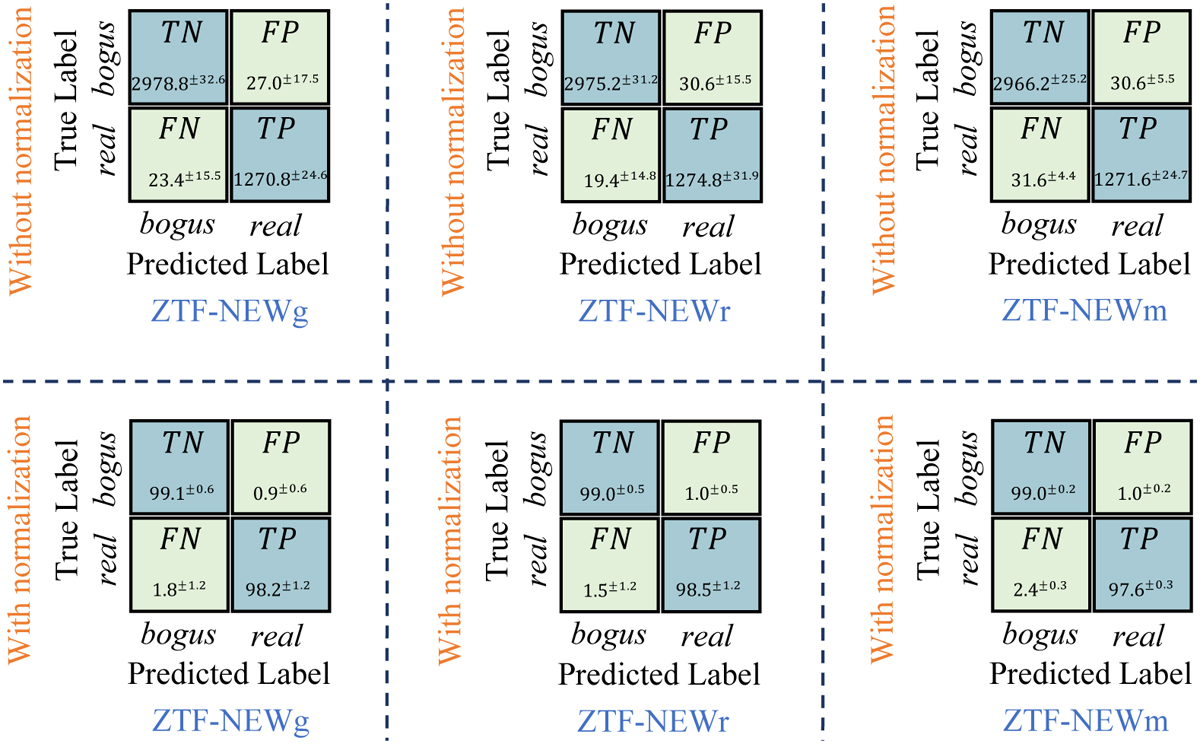
Results of confusion matrices using RB-C1000 on our three datasets. The top half of this figure represents the unnormalized results, which provide a direct representation of the raw classification outcomes. The lower half of this figure displays the normalized results.
Current usage metrics show cumulative count of Article Views (full-text article views including HTML views, PDF and ePub downloads, according to the available data) and Abstracts Views on Vision4Press platform.
Data correspond to usage on the plateform after 2015. The current usage metrics is available 48-96 hours after online publication and is updated daily on week days.
Initial download of the metrics may take a while.