| Issue |
A&A
Volume 692, December 2024
|
|
|---|---|---|
| Article Number | L7 | |
| Number of page(s) | 6 | |
| Section | Letters to the Editor | |
| DOI | https://doi.org/10.1051/0004-6361/202452542 | |
| Published online | 06 December 2024 | |
Letter to the Editor
Star formation in neutral hydrogen gas reservoirs at cosmic noon
1
Central University of Himachal Pradesh, Dharamshala, Kangra, India
2
Indian Institute of Astrophysics (IIA), Bengaluru, Karnataka, India
3
Università degli Studi di Milano-Bicocca, Dip. di Fisica G. Occhialini, Piazza della Scienza 3, 20126 Milano, Italy
4
INAF–Osservatorio Astronomico di Trieste, via G.B. Tiepolo 11, I-34143 Trieste, Italy
5
Institut d’Astrophysique de Paris, CNRS-SU, UMR 7095, 98bis bd Arago, 75014 Paris, France
6
Kavli Institute for Astronomy and Astrophysics, Peking University, Beijing 100871, PR China
7
Department of Astronomy, School of Physics, Peking University, Beijing 100871, PR China
⋆ Corresponding authors; This email address is being protected from spambots. You need JavaScript enabled to view it.
, This email address is being protected from spambots. You need JavaScript enabled to view it.
Received:
9
October
2024
Accepted:
15
November
2024
Abstract
We aim to constrain the average star formation associated with neutral hydrogen gas reservoirs at cosmic noon. We used a unprecedented sample of 1716 high-column-density, damped Ly-α absorbers (DLAs) from the Sloan Digital Sky Survey with log(N(H I)/cm−2) ≥ 21. This allowed us to generate the average Ly-α emission spectrum associated to DLAs, free from any emission coming from the background quasar. We measured the Lyα emission at > 5.8σ level with a luminosity of 8.95 ± 1.54 × 1040 erg s−1 (corresponding to about 0.02 L⋆ at z ∼ 2 − 3) in systems with average log(N(H I) /cm−2) of ≈21.2 and at a median redshift of z ∼ 2.64. The peak of the Lyα emission is apparently redshifted by ∼300 km s−1 relative to the absorption redshift, which appears to be due to suppression of blue Ly-α photons by radiative transfer through expanding gas. We infer that DLAs form stars with an average rate of (0.08 ± 0.01)/fescM⊙ yr−1; namely, ≈ (0.54 ± 0.09) M⊙ yr−1 for a typical escape fraction (fesc = 0.15) of Lyman-α emitting galaxies. DLA galaxies follow the main sequence of star-forming galaxies at high redshift, suggesting that the DLA population is dominated by the lower mass end of Lyman-α emitting galaxies.
Key words: galaxies: evolution / galaxies: formation / galaxies: high-redshift / galaxies: ISM / quasars: absorption lines / galaxies: star formation
© The Authors 2024
 Open Access article, published by EDP Sciences, under the terms of the Creative Commons Attribution License (https://creativecommons.org/licenses/by/4.0), which permits unrestricted use, distribution, and reproduction in any medium, provided the original work is properly cited.
This article is published in open access under the Subscribe to Open model. This email address is being protected from spambots. You need JavaScript enabled to view it. to support open access publication.
1. Introduction
The formation and evolution of galaxies are driven by the filamentary accretion of pristine gas from the cosmic web, which feeds the interstellar medium (ISM) and fuels star formation (Barnes & Haehnelt 2009; Fumagalli et al. 2011; Bird et al. 2014; Faucher-Giguère & Oh 2023). As the most abundant element in the Universe, hydrogen is a unique tracer, allowing us to probe gas across various scales, from interstellar to circumgalactic and intergalactic medium. However, mapping H I gas in galaxies emission is difficult even at moderate redshifts (Bera et al. 2018). At high redshift, z ≳ 2, the Damped Lyα (DLA) absorbers, characterized by hydrogen column densities of log(NH I/cm−2) ≥ 20.3, offer a direct probe of the distribution of neutral gas at a mean density around one-tenth of the star formation threshold (Cen 2012). DLAs contain a large fraction of the neutral hydrogen in the Universe and are believed to be the progenitors of normal disk galaxies (Wolfe et al. 2005; Neeleman et al. 2020; Kaur et al. 2024). They are associated with star-forming regions, as evidenced by their enrichment with redshift (Rafelski et al. 2012; Neeleman et al. 2018).
To date, several thousand DLAs at z > 2 have been discovered in the Sloan Digital Sky Survey (Prochaska & Herbert-Fort 2004; Noterdaeme et al. 2009, 2012; Chabanier et al. 2022) and hundreds of these have been followed for high-resolution spectroscopy (Ho et al. 2020). Despite these advances, our understanding of the origin of DLAs and the physical characteristics of the associated galaxies remains limited. Earlier searches based on long-slit spectroscopic measurements yielded a low detection rate of ∼10 percent which is attributed to factors such as bright background quasars, dust attenuation, or the possibility that only a subset of the DLA population is directly associated with active star formation. The efforts to map the metal-rich DLAs resulted in a higher detection rate at ∼64 percent (Krogager et al. 2017), but provide limited information on star formation rates, masses, extent of H I, and large-scale environments (Krogager et al. 2017). Despite the numerous efforts to search for DLA host galaxies in emission, until recently, only ∼25 DLA host galaxies have been discovered so far (Christensen et al. 2014; Krogager et al. 2017).
More recently, using the large 3D field of MUSE/VLT, Fumagalli et al. (2017) have detected a tantalizing example of a diffuse gas environment of about 50 kpc near a z ∼ 3.2 DLA. Mackenzie et al. (2019) have searched six DLAs using MUSE/VLT with z ≥ 3 within 1000 km s−1 and found a high detection rate of ∼80 percent with impact parameters between 25 and 280 kpc (see also Lofthouse et al. 2023). Furthermore, interferometers such as the ALMA have overcome the dust bias, with the detection of a few tens of molecular gas-rich systems using CO rotational transitions and the atomic [C II] line (Neeleman et al. 2013, 2017, 2019; Lofthouse et al. 2023; Kaur et al. 2024). So far, these studies have focused on tracing relatively high-metallicity systems, finding the DLA host at relatively large impact parameters, ∼16 − 45 kpc, and high molecular gas masses of 1010−1011 M⊙. These efforts have revealed that DLA host galaxies are similar to massive star-forming galaxies and are embedded in enriched neutral hydrogen gas reservoirs that extend well beyond the star-forming interstellar medium of these galaxies.
In an effort to study the average properties of DLAs, Fumagalli et al. (2014) measured the rest-frame far-ultraviolet (FUV) flux from DLAs in HST composite images using the ‘double-DLA’ technique, which uses two optically thick absorbers to eliminate the glare of the bright background quasars (see also O’Meara et al. 2006; Christensen et al. 2009). These authors excluded the presence of compact star-forming regions with SFRs as low as ∼ 0.1 M⊙ yr−1 at the position of the quasar. On the other hand, the spectral stacking experiments to detect the Lyα emission from the DLA host galaxy have mostly set an upper limit on Lyα luminosity and SFR (Rahmani et al. 2010; Cai et al. 2014; Joshi et al. 2016), except for metal-rich DLAs (Joshi et al. 2016). Interestingly, Noterdaeme et al. (2014) have shown that the extremely strong DLAs resemble the Lyman-α emitting galaxies (LAEs) with Lyα luminosity of ≥0.7 × 1042 erg s−1. In this Letter, we examine DLA systems with high neutral hydrogen column densities, log(NH I/cm−2) ≥ 21, which is five times lower than the threshold used by Noterdaeme et al. (2014). Using a dataset twice the size of Joshi et al. (2016), we present a clear detection of Lyα emission in these systems and explore the nature of the DLA host galaxies. The sample selection and analysis are provided in Sects. 2 and 3. The obtained results are given in Sect. 4, followed by a discussion and conclusion in Sect. 5. Throughout, we assume the flat Universe cosmology with H0 = 70 km s−1 Mpc−1, Ωm = 0.3, and ΩΛ = 0.7.
2. Sample selection
Here, we utilize the SDSS-III BOSS DLA catalogue from Noterdaeme et al. (2012) updated to Data Release-12, consisting 19 535 DLA candidates with column density log(NH I/cm−2) ≥ 20.3. In addition, we used the SDSS-IV Data Release-16 DLA catalogue from Chabanier et al. (2022). This catalogue has been constructed based on a convolutional neural network, comprising 30 019 DLAs with log(NH I/cm−2) ≥ 20.3, and high confidence level of ≥0.5. To probe the average SFR associated with DLAs at the cosmic noon, the applied selection filters were as follows: (1) the log(NH I/cm−2) ≥ 21, which ensured a dark core (τ > 10) of Lyα absorption trough spread over at least seven times the average full width at half-maximum (FWHM) of ∼160 km s−1 for the instrumental profile of the BOSS spectrograph; (2) we avoided the proximate DLAs by considering the systems with velocity offset of ≥5000 km s−1 relative to the quasar emission redshift and exclude the sightlines with broad absorption lines from quasar outflows; (3) to ensure an accurate determination of the H I column density, we imposed a continuum to noise ratio (CNR) ≥4 in the spectral region of ∼20 Å blue and redder side of the DLA wing; (4) to avoid the confusion with Lyβ forest, we only considered DLAs within in Lyα forest region. The aforementioned selection criteria resulted in 1716 absorbers over a redshift range of 1.97 < z < 4.0 with a median of z = 2.637 and a neutral hydrogen column density ranging between 21.0 ≤ log(NH I/cm−2) ≤ 22.3, with median log(NH I/cm−2) = 21.2. The sample summary is given in Table 1.
DLA sample selection.
Finally, to avoid any uncertainty in the absorption redshift and/or H I column density measurements, we further visually inspected the entire sample and measured the absorption redshift by cross-correlating the low-ionization metal absorption lines (e.g. CII λ1334, SiIIλ1526, AlIIλ1670, FeIIλλ1608, 2344, 2374, 2382, 2586, 2600, MgIIλλ2796, 2803) redward to the quasar Lyα emission. For the systems without a metal absorption line detection, we kept the redshift obtained from the H I Lyman series transitions based on the CNN models (Chabanier et al. 2022). This resulted in a final sample of 1716 (excluding duplicates among DR12 and DR16) unique DLAs, of which 1515 systems have redshift determined from metal lines.
3. Analysis
To detect faint Lyα emission, we generated the stacked spectra by shifting the individual spectrum to the rest-frame of the DLA, while conserving the flux and re-binned to a common grid, keeping the same pixel size (constant in velocity space) as the original data. To remove the contribution from any possible outliers, we have used the median and 3σ-clipped weighted mean statistics with 1/σ2 weighting, with σ being the error in the flux (see also Joshi et al. 2016). Considering the wide flat, dark absorption trough of DLAs, we did not re-scale or normalize the spectrum before the co-addition. Furthermore, to test the robustness, we generated 5000 bootstrapped stacked spectra and estimated the 1σ uncertainty over each pixel as the 16th and 84th percentiles of the flux distribution of the corresponding pixel.
We note that the residual flux level within the core of the DLA absorption profile exhibits a non-zero offset, likely related to sky-subtraction errors (Rahmani et al. 2010; Joshi et al. 2016) and/or average FUV radiation from the background quasar host galaxies (Cai et al. 2014). Our stacked DLA profile also shows a positive flux with no prominent signal blue-ward of Lyα (see Fig. A.1). We correct this offset by subtracting the weighted mean flux in the dark trough of DLA, estimated using the pixels with τ > 10, blue-ward of the line center at 1215.67 Å. Here, the IGM absorption may likely result in zero flux from DLA galaxy. This correction may potentially eliminate any continuum emission from the DLA host, but our primary interest here is on the Lyα emission line.
4. Results
In Fig. 1, we show the median and 3σ-clipped weighted mean stacked spectra of Lyα absorption trough. We detect an asymmetric flux distribution, with enhanced flux redward of the line center; namely, 1215.67 Å in the dark core of the absorption trough. Such Lyα emission profiles with enhanced red and suppressed blue peaks are naturally produced by the radiative transport of Lyα photons in an outflowing medium (Steidel et al. 2010; Dijkstra 2014; Galbiati et al. 2023). This has also been observed empirically (Steidel et al. 2010; Galbiati et al. 2023). To quantify the emission line flux, at first, we used the region redward of the line center and detected a strong Lyα emission profile at 5.8σ level with Lyα flux of (0.150 ± 0.026)×10−17 erg s−1 cm−2 in the 3σ-clipped weighted-mean stack. Similarly, for the median stack the line is detected at 4.6σ level with Lyα flux of (0.145 ± 0.032)×10−17 erg s−1 cm−2. At the median redshift of our DLA sample, namely, z ∼ 2.64, this corresponds to a Lyα luminosity of (8.64 ± 1.87)×1040 erg s−1 in the median and (8.95 ± 1.54)×1040 erg s−1 in the 3σ-clipped weighted mean stack. We get a similar luminosity of (6.45 ± 2.50)×1040 erg s−1 at 2.57σ level and (6.68 ± 2.13)×1040 erg s−1 at 3.1σ level for median and 3σ-clipped weighted mean stacks, respectively, if we integrate all the pixels in the entire dark trough with τ > 10.
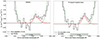 |
Fig. 1. Median (left panel) and 3σ-clipped weighted mean (right panel) stacked spectrum for 1716 DLAs with median hydrogen column density of log(NH I/cm−2) = 21.2, along with 1σ error shown in grey color. The green hatched region show the dark core of absorption trough, with optical depth (τ) > 10. The red curve shows the emergent Lyα profile, after radiative transfer of Lyα photons while considering the DLAs as expanding thin-shell geometry (see text Gurung-López et al. 2022). |
Next, using the Lyα luminosity, we estimated the average SFR associated with DLA hosts, assuming a Lyα to Hα ratio (Case B) recombination value of 8.7 (Kennicutt 1998a). However, this provides the minimal SFR as dust obscuration and escape fraction may lower the observed Lyα emission compared to the intrinsic emission. The Hα and SFR calibration [SFR(M⊙ yr−1) = 7.9 × 10−42 × LHα (erg s−1)] from Kennicutt (1998a) results in an average star formation rate ⟨SFR⟩∼0.078 ± 0.016 M⊙ yr−1. We note that the above estimate is a lower limit of SFR as it does not take into account dust and consider the Lyα escape fraction (fesc) of unity. Additionally, uncertainty in the DLA redshift could contribute to the emission line broadening, potentially leading to a loss of flux near the wings. Considering a typical escape fraction of fesc = 0.15 for high-z LAEs with a typical Lyα emission line equivalent width of < 20 Å (Matthee et al. 2016; Goovaerts et al. 2024), the average SFR in DLAs can be higher with ⟨SFR⟩ ≈ 0.9LHα/fesc ≲ 0.52 ± 0.11 (M⊙ yr−1). Using the star formation rate surface density and mean gas surface density relation:  at the low redshift from Kennicutt (1998b, see their Eq. (4)), the lower column densities that are typical for DLAs log(NH I/cm−2) ≈ 21.2 cm−2 in our sample gives an average ΣSFR = 8.75 × 10⁻³ (M⊙ yr−1 kpc−2). We note that only a small fraction, namely, ∼15% of DLAs exhibit H2 gas. However, the correlation between SFR and H I in low-density gas in conjunction with the large fraction of our DLAs exhibiting metals hints at some level of ‘in situ’ SFR (Balashev & Noterdaeme 2018). A caveat in linking the inferred SFR with the DLA column density is that the measured H I density is not averaged over the disk, but it is a local estimate along a pencil beam. Local measurements may thus introduce more substantial scatter in the relation. A partial mitigation of this effect arises from considering the average emission in a large sample of DLAs, for which we consider a range of N(H I) values. Such an average estimate will bring us closer to the underlying values (Barbieri et al. 2005). Following Noterdaeme et al. (2014, see their Eq. (10)), using the above integrated SFR, we can obtain the DLA radius as
  , which results in an average galaxy size of ∼4 kpc and ∼7 kpc for a typical fesc of 0.15 and 0.05 for LAEs and LBGs, respectively (Hayes et al. 2010; Matthee et al. 2016). We note that for the DLA galaxies of the above sizes, due to the finite SDSS(BOSS) fiber size of the radius of 1 arcsec (1.5 arcsec), which corresponds to a physical size of 8(12) kpc at the median redshift of z = 2.637, the measured fluxes suffer from the fiber losses. This is because only a part of the galaxy may lie inside the fiber (López & Chen 2012), thus, the above-measured SFR represents a lower limit on average SFR in DLAs.
We find that the Lyα emission is predominantly red-shifted relative to the systemic velocity of the DLAs with a typical line offset of 310 ± 52 km s−1 in the median stack. A similar velocity offset of 323 ± 36 km s−1 is found when considering the 3σ-clipped weighted mean stack. This velocity offset falls close to the typical peak shift of ∼230 km s−1 measured in the case of LAEs (Erb et al. 2014; Lofthouse et al. 2023) and LBGs which show a velocity offset of much less than 400 km s−1 (see Noterdaeme et al. 2014; Mackenzie et al. 2019). The median (3σ-clipped weighted mean) stacked Lyα emission line FWHM in DLAs is found to be ∼400 ± 137 (360 ± 94) km s−1. This is slightly higher than the mean FWHM of the red peak of Lyα line in LAEs, namely, ∼260 km s−1, but consistent with the LBGs FWHM of 364 km s−1 (Trainor et al. 2015). The excess line broadening can be reconciled with the redshift uncertainty of DLAs and the range of velocity offset and Lyα profiles from the DLA population, which introduces line broadening while stacking.
5. Discussion and conclusions
We used the largest set of 1716 high N(H I) DLAs to obtain direct limits on the in situ SFRs in DLAs. Several spectral stacking experiments have been performed in literature to detect the residual Lyα emission in the dark core of the DLA trough. Rahmani et al. (2010) studied the stacked spectra of DLAs with log(NH I/cm−2) ≥ 20.62 and set a 2σ upper limit on the Lyα luminosity from DLA gas at ≤2 × 1041 erg s−1, which corresponds to a SFR of < 0.8 M⊙ yr−1 at z ∼ 2.8. In another stacking experiment, Cai et al. (2014) have used ∼2000 DLA systems with log(NH I/cm−2) > 20.6 at a median absorption redshift of ⟨z⟩ = 2.6. They did not detect any Lyα emission signature in the dark trough of composite spectra. Using ∼100 extremely strong DLAs with log(NH I/cm−2) > 21.7, probing a small subset of DLA populations, Noterdaeme et al. (2014) detected the Lyα emission with luminosity of ∼0.6 ± 0.2 × 1042 erg s−1 (corresponding to about 0.1 L⋆ at z ∼ 2 − 3). For a DLA population of log(NH I/cm−2) > 21, Joshi et al. (2016) detected a hint of Lyα emission at 2.8σ level in the red part of the DLA trough with a luminosity of < 1041(3σ) erg s−1. They found that the metal-rich systems show stronger Lyα emission. Here, we have detected a strong signature of Lyα emission at > 5σ level, with an average luminosity of (8.64 ± 1.87) 1040 erg s−1 and SFR of ∼0.078 ± 0.016 M⊙ yr−1. This value is consistent with the average SFR detection limit (at 2σ) of 0.09 M⊙ yr−1 observed over an aperture of 2 kpc in direct HST imaging of DLA host galaxies with log(NH I/cm−2) of 20.3–21.3 by Fumagalli et al. (2015).
We further explored the SFR relation with the observed neutral gas in absorption. Using our in-situ SFR measurement, we derived the star-formation surface density using a typical Lyman-alpha (Lyα) halo scale length of approximately 4.5 kpc, derived from observations of high-redshift star-forming galaxies (3 ≤ z ≤ 6) in the MUSE Hubble Ultra Deep Field Survey (Leclercq et al. 2017). For such scale lengths, the SDSS fiber probing a physical size of ∼12 kpc likely integrates the light from the DLA host. In Fig. 2, we plot the star-formation surface density (ΣSFR), assuming fesc = 0.05 and fesc = 0.15 for LBGs and LAEs, with HI gas surface density of Σgas. It is evident that the DLAs and ESDLAs follow the KS-law for a range of H I densities (see also Noterdaeme et al. 2014; Fumagalli et al. 2015.
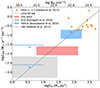 |
Fig. 2. SFR surface densities ΣSFR of DLAs from the spectral stacks. Limits on the SFR surface densities derived from the composite images are shown as horizontal hatched blue bars (Fumagalli et al. 2015). The grey shaded region show the ΣSFR detected in the outskirts of LBGs Rafelski et al. (2011), and the blue shaded region shows the ESDLA (N(H I) > 1021.7 cm−2) (Noterdaeme et al. 2014). The dotted black line shows where the extrapolation of the local SF law. Our results shows log N(H I/cm−2)≥21 to 22.35 with range of fesc, 0.05 and 0.15 showing dashed (red dashed) region. |
Previous efforts to study the DLA host galaxies suggest a strong association with LAEs (Noterdaeme et al. 2014; Rubin et al. 2015; Lofthouse et al. 2023). By leveraging the average Lyα luminosity of DLAs and incorporating the main sequence relation, we can estimate the stellar mass of DLAs using the equation presented by Goovaerts et al. (2023). The result is log(M⋆/M⊙) = (0.85 ± 0.17) log(LLyα/erg s−1) – (27.8 ± 6.4), yielding an average stellar mass of log(M⋆/M⊙) = 6.9 ± 0.6. In Fig. 3, we compare the stellar mass and average SFR in DLAs with SFGs at z ∼ 1 − 3 (Genzel et al. 2010), along with a handful of known DLA host galaxies (Rhodin et al. 2021). This suggests that on an average the DLAs with log(NH I/cm−2) ≥ 21 probe the lower mass end of SFG.
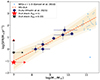 |
Fig. 3. Star formation main sequence of star-forming galaxies (triangle) from Genzel et al. (2010), and the direct detection of DLAs (circle) along with the best-fit MS relation (dashed black line) from Rhodin et al. (2021). The lower limit (arrow) of the stacked spectra measurements (star) is also shown. |
We also find that the Lyα emission shows an asymmetric emission feature with a dominant red peak and suppressed blue peak with systemic velocity offset with respect to DLA profile of ∼310 ± 52 km s−1 (323 ± 36 km s−1) in the median (3σ-clipped weighted mean) stack. This velocity shift implies a kinematic difference between the emitting and absorbing neutral hydrogen gas, potentially due to gas in-and-outflows or complex dynamics within these galaxies. Another possibility is that the DLA gas is rotating, with non-uniform star formation throughout (Ogura et al. 2020). To obtain further insight into the gas geometry and kinematics in DLAs, we modelled the observed Lyα emission profile using the thin shell model, which consists of a central Lyα source, surrounded by an expanding outflowing thin, spherical shell of hydrogen and dust. It successfully reproduces the diversity of line profiles such as broad absorption in some Lyman break galaxies to asymmetric emission in LAEs (Verhamme et al. 2006). For this, we used the ZELDA1 routine which uses an isothermal homogeneous spherical thin layer of neutral hydrogen gas with a constant gas temperature of 104 K and a homogeneous radial bulk velocity. In addition, the dust optical depth is set to  , where E⊙ = 1.77 × 10⁻²¹ cm−2 is the ratio τa/NH for solar metallicity, ALyα = 0.39 is the albedo at the Lyα wavelength, Z⊙ = 0.02 (Granato et al. 2000). For this purpose, we varied the column density for log(NH I/cm−2) between 17 and 22. The radiative transfer modelling of DLAs as an expanding shell results in an expansion velocity V
 , and a dust optical depth of log(
 . The posterior distributions of the fitted parameter are shown in Fig. A.2.
The similar velocity offset, gas kinematics, and tight SFR-MS relation between the DLAs and LAEs hint at a close association between the two populations. Considering DLAs as LAEs, for a typical characteristic luminosity of LAEs, L⋆ = 5 × 1042 erg s−1 (Cassata et al. 2011), our average Lyα emission imply that DLAs traces the low-luminosity population. This is typically ∼0.02 L⋆, of LAEs. The long-slit spectroscopy efforts have detected the galaxy counterparts at small impact parameters of < 15 kpc, suggesting a close association with the LAEs (Christensen et al. 2014; Krogager et al. 2017). Moreover, the MUSE surveys with a large 3D wide field of view have confirmed the association between DLAs and LAEs even at distances exceeding 50 kpc (Fumagalli et al. 2017; Rubin et al. 2015; Mackenzie et al. 2019). In contrast, at z ≳ 4 DLA galaxies are generally found at impact parameters of ≈15–60 kpc (Neeleman et al. 2017, 2019; Kaur et al. 2024), suggesting their origin in CGM gas. We note that the impact parameter is found to be decreasing with the increasing column density; thus, by selecting the log(NH I/cm−2) ≥ 21, we are more likely to probe the small impact parameters (see Krogager et al. 2017; Rahmati & Schaye 2014). Moreover, the environment also plays a crucial role, as observations suggest higher detections of LAEs in environments with high column density absorbers, indicating that LAEs may trace larger-scale structures that include DLAs (Lofthouse et al. 2020). The same picture is corroborated by the EAGLE cosmological simulations, which indicate that the DLAs trace neutral regions within halos with characteristic masses of Mh ≈ 1011 − 1012 M⊙ and likely associated with the LAEs; in that case, both are influenced by the same underlying dark matter halo (Font-Ribera et al. 2012). A follow-up study to trace galaxy counterparts, at small impact parameters for a metallicity-unbiased DLA sample is crucial to uncover the faint-end population of LAEs.
Acknowledgments
We are thankful to the anonymous referee for constructive suggestions. LCH was supported by the National Science Foundation of China (11991052, 12233001), the National Key R&D Program of China (2022YFF0503401), and the China Manned Space Project (CMS-CSST-2021-A04, CMS-CSST-2021-A06). HC and Dharmender are grateful to IUCAA for the hospitality under IUCAA associate programme.
References
- Balashev, S., & Noterdaeme, P. 2018, MNRAS, 478, L7 [NASA ADS] [CrossRef] [Google Scholar]
- Barbieri, C. V., Fraternali, F., Oosterloo, T., et al. 2005, A&A, 439, 947 [NASA ADS] [CrossRef] [EDP Sciences] [Google Scholar]
- Barnes, L. A., & Haehnelt, M. G. 2009, MNRAS, 397, 511 [NASA ADS] [CrossRef] [Google Scholar]
- Bera, A., Kanekar, N., Weiner, B. J., Sethi, S., & Dwarakanath, K. S. 2018, ApJ, 865, 39 [NASA ADS] [CrossRef] [Google Scholar]
- Bird, S., Vogelsberger, M., Haehnelt, M., et al. 2014, MNRAS, 445, 2313 [NASA ADS] [CrossRef] [Google Scholar]
- Cai, Z., Fan, X., Noterdaeme, P., et al. 2014, ApJ, 793, 139 [NASA ADS] [CrossRef] [Google Scholar]
- Cassata, P., Le Fèvre, O., Garilli, B., et al. 2011, A&A, 525, A143 [NASA ADS] [CrossRef] [EDP Sciences] [Google Scholar]
- Cen, R. 2012, ApJ, 748, 121 [NASA ADS] [CrossRef] [Google Scholar]
- Chabanier, S., Etourneau, T., Le Goff, J.-M., et al. 2022, ApJS, 258, 18 [NASA ADS] [CrossRef] [Google Scholar]
- Christensen, L., Noterdaeme, P., Petitjean, P., Ledoux, C., & Fynbo, J. P. U. 2009, A&A, 505, 1007 [NASA ADS] [CrossRef] [EDP Sciences] [Google Scholar]
- Christensen, L., Møller, P., Fynbo, J. P. U., & Zafar, T. 2014, MNRAS, 445, 225 [NASA ADS] [CrossRef] [Google Scholar]
- Dijkstra, M. 2014, PASA, 31, e040 [Google Scholar]
- Erb, D. K., Steidel, C. C., Trainor, R. F., et al. 2014, ApJ, 795, 33 [Google Scholar]
- Faucher-Giguère, C.-A., & Oh, S. P. 2023, ARA&A, 61, 131 [CrossRef] [Google Scholar]
- Font-Ribera, A., Miralda-Escudé, J., Arnau, E., et al. 2012, JCAP, 2012, 059 [CrossRef] [Google Scholar]
- Fumagalli, M., Prochaska, J. X., Kasen, D., et al. 2011, MNRAS, 418, 1796 [CrossRef] [Google Scholar]
- Fumagalli, M., O’Meara, J. M., Prochaska, J. X., Kanekar, N., & Wolfe, A. M. 2014, MNRAS, 444, 1282 [NASA ADS] [CrossRef] [Google Scholar]
- Fumagalli, M., O’Meara, J. M., Prochaska, J. X., Rafelski, M., & Kanekar, N. 2015, MNRAS, 446, 3178 [NASA ADS] [CrossRef] [Google Scholar]
- Fumagalli, M., Mackenzie, R., Trayford, J., et al. 2017, MNRAS, 471, 3686 [NASA ADS] [CrossRef] [Google Scholar]
- Galbiati, M., Fumagalli, M., Fossati, M., et al. 2023, MNRAS, 524, 3474 [NASA ADS] [CrossRef] [Google Scholar]
- Genzel, R., Tacconi, L., Gracia-Carpio, J., et al. 2010, MNRAS, 407, 2091 [NASA ADS] [CrossRef] [Google Scholar]
- Goovaerts, I., Pello, R., Thai, T., et al. 2023, A&A, 678, A174 [NASA ADS] [CrossRef] [EDP Sciences] [Google Scholar]
- Goovaerts, I., Pello, R., Burgarella, D., et al. 2024, A&A, 683, A184 [NASA ADS] [CrossRef] [EDP Sciences] [Google Scholar]
- Granato, G. L., Lacey, C. G., Silva, L., et al. 2000, ApJ, 542, 710 [Google Scholar]
- Gurung-López, S., Gronke, M., Saito, S., Bonoli, S., & Orsi, Á. A. 2022, MNRAS, 510, 4525 [NASA ADS] [CrossRef] [Google Scholar]
- Hayes, M., Östlin, G., Schaerer, D., et al. 2010, Nature, 464, 562 [NASA ADS] [CrossRef] [Google Scholar]
- Ho, M.-F., Bird, S., & Garnett, R. 2020, MNRAS, 496, 5436 [NASA ADS] [CrossRef] [Google Scholar]
- Joshi, R., Srianand, R., Noterdaeme, P., & Petitjean, P. 2016, MNRAS, submitted [arXiv:1610.06580] [Google Scholar]
- Kaur, B., Kanekar, N., Neeleman, M., et al. 2024, ApJ, 971, L33 [NASA ADS] [CrossRef] [Google Scholar]
- Kennicutt, R. C. 1998a, ARA&A, 36, 189 [NASA ADS] [CrossRef] [Google Scholar]
- Kennicutt, R. C. 1998b, ApJ, 498, 541 [NASA ADS] [CrossRef] [Google Scholar]
- Krogager, J.-K., Møller, P., Fynbo, J., & Noterdaeme, P. 2017, MNRAS, 469, 2959 [NASA ADS] [CrossRef] [Google Scholar]
- Leclercq, F., Bacon, R., Wisotzki, L., et al. 2017, A&A, 608, A8 [NASA ADS] [CrossRef] [EDP Sciences] [Google Scholar]
- Lofthouse, E. K., Fumagalli, M., Fossati, M., et al. 2020, MNRAS, 491, 2057 [NASA ADS] [CrossRef] [Google Scholar]
- Lofthouse, E. K., Fumagalli, M., Fossati, M., et al. 2023, MNRAS, 518, 305 [Google Scholar]
- López, G., & Chen, H.-W. 2012, MNRAS, 419, 3553 [CrossRef] [Google Scholar]
- Mackenzie, R., Fumagalli, M., Theuns, T., et al. 2019, MNRAS, 487, 5070 [NASA ADS] [CrossRef] [Google Scholar]
- Matthee, J., Sobral, D., Best, P., et al. 2016, MNRAS, 465, 3637 [Google Scholar]
- Neeleman, M., Wolfe, A. M., Prochaska, J. X., & Rafelski, M. 2013, ApJ, 769, 54 [NASA ADS] [CrossRef] [Google Scholar]
- Neeleman, M., Kanekar, N., Prochaska, J. X., et al. 2017, Science, 355, 1285 [NASA ADS] [CrossRef] [Google Scholar]
- Neeleman, M., Kanekar, N., Prochaska, J. X., et al. 2018, ApJ, 856, L12 [NASA ADS] [CrossRef] [Google Scholar]
- Neeleman, M., Kanekar, N., Prochaska, J. X., Rafelski, M. A., & Carilli, C. L. 2019, ApJ, 870, L19 [NASA ADS] [CrossRef] [Google Scholar]
- Neeleman, M., Prochaska, J. X., Kanekar, N., & Rafelski, M. 2020, Nature, 581, 269 [Google Scholar]
- Noterdaeme, P., Petitjean, P., Ledoux, C., & Srianand, R. 2009, A&A, 505, 1087 [NASA ADS] [CrossRef] [EDP Sciences] [Google Scholar]
- Noterdaeme, P., Laursen, P., Petitjean, P., et al. 2012, A&A, 540, A63 [NASA ADS] [CrossRef] [EDP Sciences] [Google Scholar]
- Noterdaeme, P., Petitjean, P., Pâris, I., et al. 2014, A&A, 566, A24 [NASA ADS] [CrossRef] [EDP Sciences] [Google Scholar]
- Ogura, K., Umehata, H., Taniguchi, Y., et al. 2020, PASJ, 72, 29 [NASA ADS] [CrossRef] [Google Scholar]
- O’Meara, J. M., Chen, H.-W., & Kaplan, D. L. 2006, ApJ, 642, L9 [CrossRef] [Google Scholar]
- Prochaska, J. X., & Herbert-Fort, S. 2004, PASP, 116, 622 [NASA ADS] [CrossRef] [Google Scholar]
- Rafelski, M., Wolfe, A. M., & Chen, H.-W. 2011, ApJ, 736, 48 [NASA ADS] [CrossRef] [Google Scholar]
- Rafelski, M., Wolfe, A. M., Prochaska, J. X., Neeleman, M., & Mendez, A. J. 2012, ApJ, 755, 89 [NASA ADS] [CrossRef] [Google Scholar]
- Rahmani, H., Srianand, R., Noterdaeme, P., & Petitjean, P. 2010, MNRAS, 409, L59 [NASA ADS] [Google Scholar]
- Rahmati, A., & Schaye, J. 2014, MNRAS, 438, 529 [NASA ADS] [CrossRef] [Google Scholar]
- Rhodin, N., Krogager, J., Christensen, L., et al. 2021, MNRAS, 506, 546 [NASA ADS] [CrossRef] [Google Scholar]
- Rubin, K. H., Hennawi, J. F., Prochaska, J. X., et al. 2015, ApJ, 808, 38 [NASA ADS] [CrossRef] [Google Scholar]
- Steidel, C. C., Erb, D. K., Shapley, A. E., et al. 2010, ApJ, 717, 289 [Google Scholar]
- Trainor, R. F., Steidel, C. C., Strom, A. L., & Rudie, G. C. 2015, ApJ, 809, 89 [NASA ADS] [CrossRef] [Google Scholar]
- Verhamme, A., Schaerer, D., & Maselli, A. 2006, A&A, 460, 397 [NASA ADS] [CrossRef] [EDP Sciences] [Google Scholar]
- Wolfe, A. M., Gawiser, E., & Prochaska, J. X. 2005, ARA&A, 43, 861 [NASA ADS] [CrossRef] [Google Scholar]
Appendix A: Uncorrected 3σ-clipped weighted mean profile and zELDA parameter distribution for Lyα emission
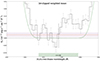 |
Fig. A.1. 3σ-clipped weighted mean profile without zero-level correction. The average flux in the dark core of the DLA trough, blueward of the line center, is shown as dashed line, along with the mean error. |
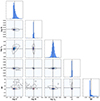 |
Fig. A.2. Posterior distributions for free parameters from zELDA radiative transfer modeling of Lyα emission line profile in 3σ-clipped weighted mean stack, at redshift 2.635, Vexp = |

All Tables
All Figures
|
Fig. 1. Median (left panel) and 3σ-clipped weighted mean (right panel) stacked spectrum for 1716 DLAs with median hydrogen column density of log(NH I/cm−2) = 21.2, along with 1σ error shown in grey color. The green hatched region show the dark core of absorption trough, with optical depth (τ) > 10. The red curve shows the emergent Lyα profile, after radiative transfer of Lyα photons while considering the DLAs as expanding thin-shell geometry (see text Gurung-López et al. 2022). |
| In the text | |
|
Fig. 2. SFR surface densities ΣSFR of DLAs from the spectral stacks. Limits on the SFR surface densities derived from the composite images are shown as horizontal hatched blue bars (Fumagalli et al. 2015). The grey shaded region show the ΣSFR detected in the outskirts of LBGs Rafelski et al. (2011), and the blue shaded region shows the ESDLA (N(H I) > 1021.7 cm−2) (Noterdaeme et al. 2014). The dotted black line shows where the extrapolation of the local SF law. Our results shows log N(H I/cm−2)≥21 to 22.35 with range of fesc, 0.05 and 0.15 showing dashed (red dashed) region. |
| In the text | |
|
Fig. 3. Star formation main sequence of star-forming galaxies (triangle) from Genzel et al. (2010), and the direct detection of DLAs (circle) along with the best-fit MS relation (dashed black line) from Rhodin et al. (2021). The lower limit (arrow) of the stacked spectra measurements (star) is also shown. |
| In the text | |
|
Fig. A.1. 3σ-clipped weighted mean profile without zero-level correction. The average flux in the dark core of the DLA trough, blueward of the line center, is shown as dashed line, along with the mean error. |
| In the text | |
|
Fig. A.2. Posterior distributions for free parameters from zELDA radiative transfer modeling of Lyα emission line profile in 3σ-clipped weighted mean stack, at redshift 2.635, Vexp = |
| In the text | |
Current usage metrics show cumulative count of Article Views (full-text article views including HTML views, PDF and ePub downloads, according to the available data) and Abstracts Views on Vision4Press platform.
Data correspond to usage on the plateform after 2015. The current usage metrics is available 48-96 hours after online publication and is updated daily on week days.
Initial download of the metrics may take a while.