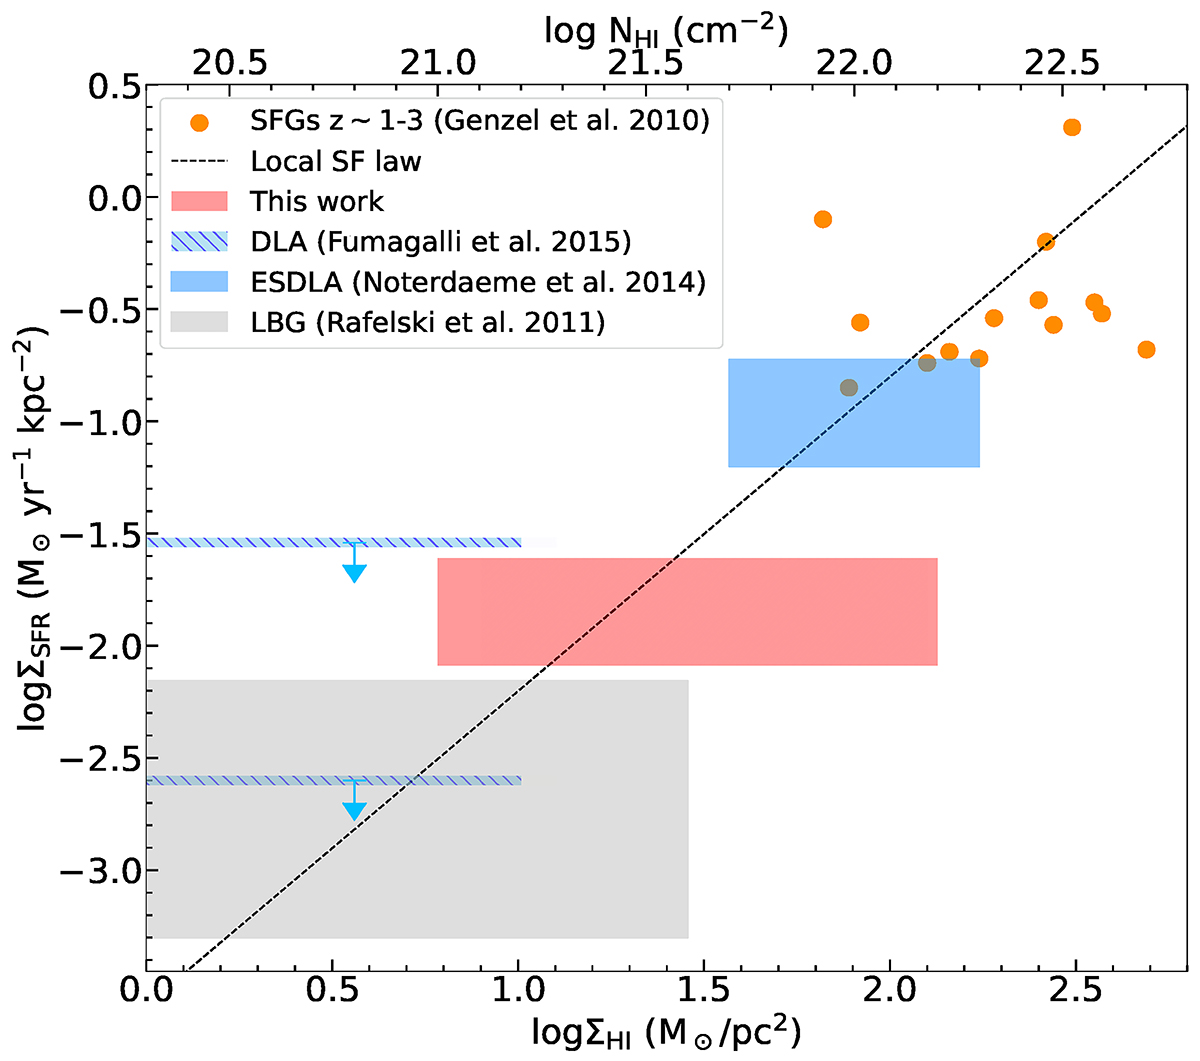
Fig. 2.
Download original image
SFR surface densities ΣSFR of DLAs from the spectral stacks. Limits on the SFR surface densities derived from the composite images are shown as horizontal hatched blue bars (Fumagalli et al. 2015). The grey shaded region show the ΣSFR detected in the outskirts of LBGs Rafelski et al. (2011), and the blue shaded region shows the ESDLA (N(H I) > 1021.7 cm−2) (Noterdaeme et al. 2014). The dotted black line shows where the extrapolation of the local SF law. Our results shows log N(H I/cm−2)≥21 to 22.35 with range of fesc, 0.05 and 0.15 showing dashed (red dashed) region.
Current usage metrics show cumulative count of Article Views (full-text article views including HTML views, PDF and ePub downloads, according to the available data) and Abstracts Views on Vision4Press platform.
Data correspond to usage on the plateform after 2015. The current usage metrics is available 48-96 hours after online publication and is updated daily on week days.
Initial download of the metrics may take a while.