Fig. 1.
Download original image
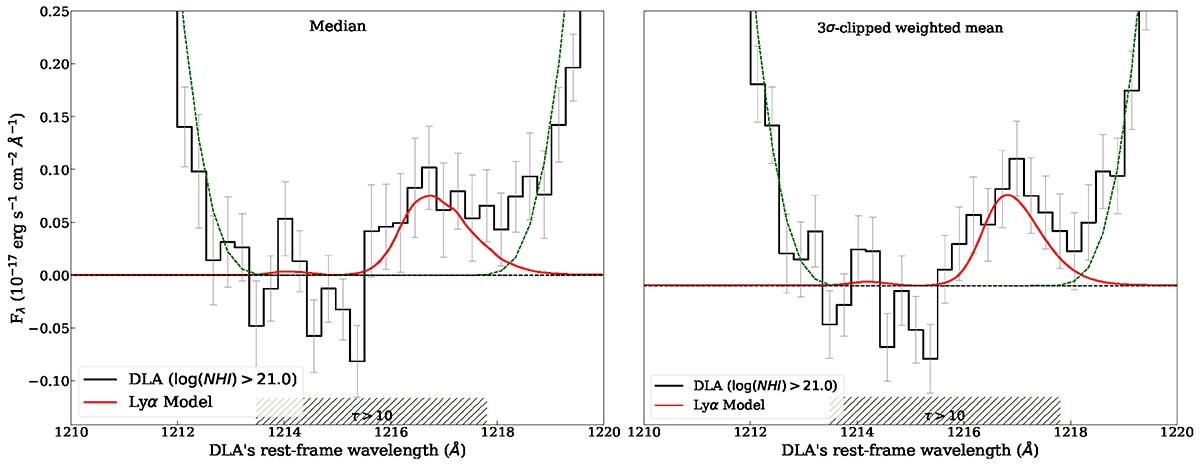
Median (left panel) and 3σ-clipped weighted mean (right panel) stacked spectrum for 1716 DLAs with median hydrogen column density of log(NH I/cm−2) = 21.2, along with 1σ error shown in grey color. The green hatched region show the dark core of absorption trough, with optical depth (τ) > 10. The red curve shows the emergent Lyα profile, after radiative transfer of Lyα photons while considering the DLAs as expanding thin-shell geometry (see text Gurung-López et al. 2022).
Current usage metrics show cumulative count of Article Views (full-text article views including HTML views, PDF and ePub downloads, according to the available data) and Abstracts Views on Vision4Press platform.
Data correspond to usage on the plateform after 2015. The current usage metrics is available 48-96 hours after online publication and is updated daily on week days.
Initial download of the metrics may take a while.