| Issue |
A&A
Volume 692, December 2024
|
|
|---|---|---|
| Article Number | A258 | |
| Number of page(s) | 12 | |
| Section | Extragalactic astronomy | |
| DOI | https://doi.org/10.1051/0004-6361/202450809 | |
| Published online | 17 December 2024 | |
Morphologies of galaxies within voids
1
Departamento de Física Teórica y del Cosmos, Edificio Mecenas, Campus Fuentenueva, Universidad de Granada, E-18071 Granada, Spain
2
Instituto Carlos I de Física Teórica y Computacional, Facultad de Ciencias, Universidad de Granada, E-18071 Granada, Spain
3
Département de Physique, de Génie Physique et d’Optique, Université Laval, and Centre de Recherche en Astrophysique du Québec (CRAQ), Québec, QC G1V 0A6, Canada
4
Instituto de Astrofísica de Andalucía – CSIC, Glorieta de la Astronomía s.n., E-18008 Granada, Spain
⋆ Corresponding author; This email address is being protected from spambots. You need JavaScript enabled to view it.
Received:
21
May
2024
Accepted:
4
November
2024
Abstract
Context. Among the largest structures in which matter is distributed in the Universe, we find cosmic voids, which are large, under-dense regions almost devoid of galaxies. The study of these structures and the galaxies that inhabit them, the void galaxies, provides key information for understanding galaxy evolution.
Aims. In this work we investigate the effects of the environment on the evolution of void galaxies. In particular, we study their morphology and explore its dependence on the location within the void where the galaxies reside, as well as on the properties of the void, such as its size and the galaxy number density.
Methods. The sample of void galaxies that we use in this study is based on the catalogue of cosmic voids and void galaxies in the Sloan Digital Sky Survey Data Release 7 (SDSS-DR7). As we are interested in studying the morphology of void galaxies, we select galaxies in the redshift range of 0.005 ≤ z ≤ 0.080, and use the public galaxy morphologies of the SDSS sample together with deep learning algorithms to divide the sample into early- and late-type void galaxies. We analyse the fractions of galaxies of each morphological type as a function of the void-centric distance, the size of the voids, and the density of galaxies in each void.
Results. There is a higher abundance of late-type galaxies with respect to early-type galaxies within voids, which remains nearly constant from the inner to the outer part of the voids. We do not find any dependence of the fraction of early- and late-type galaxies on void size or on the number-density of galaxies in the voids.
Conclusions. Galaxies in voids follow the morphology–density relation, in the sense that the majority of the galaxies in voids (the most under-dense large-scale environments) are late-type galaxies. However, we find no difference between voids with lower or higher volume number-density of galaxies: the fractions of early- and late-type galaxies do not depend on the density of the voids. The physical processes responsible for the evolution from late towards earlier types (such as external environmental quenching) are not sufficiently effective in voids or are so slow (internal secular quenching) that their contributions do not appear in the morphology–density relation.
Key words: galaxies: evolution / galaxies: fundamental parameters / galaxies: general / large-scale structure of Universe
© The Authors 2024
 Open Access article, published by EDP Sciences, under the terms of the Creative Commons Attribution License (https://creativecommons.org/licenses/by/4.0), which permits unrestricted use, distribution, and reproduction in any medium, provided the original work is properly cited.
This article is published in open access under the Subscribe to Open model. This email address is being protected from spambots. You need JavaScript enabled to view it. to support open access publication.
1. Introduction
Cosmic voids are large under-dense regions present in the hierarchical large-scale structure of the Universe. Surrounded by dense structure (filaments, walls, and clusters), voids are an essential component of the cosmic web (Bond et al. 1996; van de Weygaert & Platen 2011; Mao et al. 2017; Jaber et al. 2024), representing about 80% of the volume of the Universe. Cosmic voids have been recognised as interesting cosmological laboratories for investigating galaxy evolution, structure formation, and cosmology (Hahn et al. 2007; Tikhonov & Klypin 2009; Lares et al. 2017; Ceccarelli et al. 2013; Li et al. 2024). In particular, there is increased interest in galaxies residing in voids, the so-called void galaxies (Grogin & Geller 1999; Pustilnik et al. 2002; Benson et al. 2003; Rojas et al. 2004). Void galaxies are considered as the loneliest galaxies in the Universe, since they are in general further away from each other than galaxies that are located in clusters, filaments, and walls (Habouzit et al. 2020). The pristine low-density environment of voids provides an ideal place to examine the influence of environment on the formation and evolution of galaxies. There are therefore many works that study the void galaxies and compare their properties with galaxies found in high-density regions in the Universe (e.g. Szomoru et al. 1996; Kuhn et al. 1997; Popescu et al. 1997; Hoyle et al. 2005; Patiri et al. 2006; Kreckel et al. 2015; Beygu et al. 2017; Rosas-Guevara et al. 2022; Rodríguez-Medrano et al. 2023), and these studies are raising exciting questions and are providing some answers.
Generally, void galaxies contain less stellar mass, are bluer, have slightly lower stellar metallicities, and show later-type morphology than galaxies in denser environments (Grogin & Geller 2000; Rojas et al. 2004; Croton et al. 2005; Padilla et al. 2010; Hoyle et al. 2012; Florez et al. 2021; Porter et al. 2023; Domínguez-Gómez et al. 2023a). These differences are not easy to understand considering that, even though the fraction of star-forming galaxies in voids is higher than in filaments and walls (Ceccarelli et al. 2008; Liu et al. 2015), no significant differences are found in terms of luminosity, stellar population, and specific star formation rate (Das et al. 2015; Beygu et al. 2016; Moorman et al. 2016; Domínguez-Gómez et al. 2022). Contradictory results are found with respect to the gas content and gas-phase metallicities of void galaxies with respect to denser large-scale environments (Pustilnik et al. 2011; Kreckel et al. 2015). The discrepancies related to gas content and metallicities might be related to different star formation histories (SFHs), where void galaxies have, on average, slower SFHs than galaxies in filaments, walls, and clusters (Domínguez-Gómez et al. 2023b). Moreover, these differences in SFH could also be related to the different properties of the voids, or to the location of the galaxies within voids. Using numerical simulations, Jaber et al. (2024) show that cosmic voids possess an intricate internal network of substructures, making them a complex environment for galaxy formation and evolution. Therefore, the internal matter distribution within the void (i.e. void environment) might have an impact on the properties and evolution of void galaxies. To understand the impact of the void environment on galaxy evolution, it is important to have a well-defined sample of void galaxies for a large and diverse sample of cosmic voids, covering the widest possible range of void properties.
A few works have studied the properties of void galaxies, and their morphology in particular, considering the properties of the voids in which these galaxies reside. Ricciardelli et al. (2017) explored the morphology of galaxies located in the proximity of 630 cosmic voids selected from the catalogue of voids identified by Varela et al. (2012) based on the seventh data release of the Sloan Digital Sky Survey (SDSS-DR7, Abazajian et al. 2009). The galaxies identified by Ricciardelli et al. (2017) within their sample of voids have a redshift range of 0.01 ≤ z ≤ 0.12, and reside within voids ranging from 10 h−1 Mpc to 18 h−1 Mpc in size. These galaxies are situated in the outskirts of the voids (the void external region with 0.8 < r/Rvoid < 2.5, where r is the comoving distance from the centre of a void and Rvoid is the void radius). Ricciardelli et al. (2017) found a significant correlation between galaxy morphology and the distance from the centre of the void, where the fraction of early-type galaxies increases, and the fraction of late-type galaxies decreases, when moving from the centre to the edges of the voids. These authors also found that early-type galaxies tend to be found in the vicinity of relatively large voids, and therefore the predominant type or morphology of void galaxies is also influenced by the size of the void. However, it is important to note that the study of Ricciardelli et al. (2017) focuses on galaxies located in the surroundings of voids (0.8 < r/Rvoid < 2.5), and does not take into account the galaxies located in their inner regions. Recently, Rodríguez-Medrano et al. (2023) analysed whether the properties of void galaxies are sensitive to the type of voids they inhabit and to the local environment within the void using information from the Sloan Digital Sky Survey Data Release 16 (SDSS-DR16; Ahumada et al. 2020). They classified voids according to their integrated contrast density profile, separating S-type from R-type voids1, which is qualitatively consistent with the separation into small and large sizes in Ricciardelli et al. (2017). Rodríguez-Medrano et al. (2023) found that, regardless of the void region (including the inner regions of the voids), galaxies in S-type voids are redder, more passive, and are more concentrated than galaxies in R-type voids. Their results support the idea that the differences in the colour and morphology of galaxies in the void outskirts might be related to their environment. The morphology classification used in Rodríguez-Medrano et al. (2023) is based on concentration r90/r50 (where 90 and r50 are the radii containing 90% and 50% of the total flux of the galaxy, respectively), which is only a proxy for galaxy morphology.
In the present work, we aim to better understand the effect of void environment on the morphology of void galaxies, from the inner regions of the voids to their edges. This work complements previous studies by characterising galaxies within voids using a well-defined sample of void galaxies in the local Universe. We use the Pan et al. (2012) catalogue of cosmic voids and void galaxies to study how the galaxies are distributed inside voids according to their morphology, and how this distribution depends on the size of the voids. To account for the morphology of the galaxies, we use the morphology classification by Domínguez Sánchez et al. (2018) for galaxies in the SDSS; these authors combined accurate existing visual classification catalogues with machine learning techniques, providing the largest and most accurate morphological catalogue to date.
This work is organised as follows. In Sect. 2.1 we describe the sample of voids and void galaxies used in this work. In Sect. 2.2 we describe the morphology classification method that we used for our sample. In Sect. 3 we show the main results regarding the morphology of the void galaxies, and discuss these results in Sect. 4, comparing them with results obtained by Ricciardelli et al. (2017) and Rodríguez-Medrano et al. (2023). Finally, in Sect. 5 we present the main conclusions of this work. Throughout the paper, we use a cosmology with ΩΛ0 = 0.7, Ωm0 = 0.3, and H0 = 70 km s−1 Mpc−1.
2. Data and the sample
2.1. Void galaxy sample
The sample of void galaxies that we use in this study is based on the catalogues of cosmic voids and void galaxies compiled by Pan et al. (2012) using photometric and spectroscopic data from the SDSS-DR7 (Abazajian et al. 2009). Pan et al. (2012) studied the distribution of cosmic voids and void galaxies using the three-dimensional distribution of galaxies in the SDSS-DR7. Pan et al. (2012) used the VoidFinder algorithm as described by Hoyle & Vogeley (2002) based on the original method by El-Ad et al. (1997). This is a galaxy-based void-finding algorithm that uses redshift data to objectively find voids using a nearest-neighbour algorithm on a volume-limited galaxy catalogue. From this catalogue, galaxies are initially classified as wall or void galaxies2. If the distance to the third nearest neighbour is lower than 7 Mpc, a galaxy is considered as a wall galaxy, and is considered as a potential void galaxy if the distance is larger (Pan et al. 2012). Potential void galaxies are then removed from the initial sample, using the remaining galaxies (wall galaxies) to identify the voids. The VoidFinder algorithm (El-Ad et al. 1997; Hoyle & Vogeley 2002) grows empty cells as spheres in the distribution of wall galaxies, merging the spheres when there is more than 50% overlap. Note that the centre of the maximal sphere is not confined to the initial cell, but when the sphere is bound by four wall galaxies. The centre of the void is therefore defined by the algorithm, with a cut-off of 10 h−1 Mpc for the minimum radius of a void region (Pan et al. 2012). Finally, potential void galaxies are put back to identify the ones falling within voids as void galaxies. In this context, the SDSS main galaxy sample (with redshift completeness for galaxies with Petrosian r-band magnitude r < 17.77) is ideal for identifying a statistically significant sample of cosmic voids.
Pan et al. (2012) used the Korea Institute for Advanced Study Value-Added Galaxy Catalogue (KIAS-VAGC; Choi et al. 2010), the main source of which is the New York University Value-Added Galaxy Catalogue large-scale structure sample (NYU-VAGC; Blanton et al. 2005), which is, itself, also based on SDSS-DR7. This resulted in a primary sample of 120 606 galaxies, in a magnitude range with high completeness in the range of 10.0 ≤r≤ 17.6, in a volume-limited sample with a redshift of z < 0.107 and an absolute magnitude in the r-band of Mr < −20.09. Using this sample, Pan et al. (2012) identified 1054 statistically significant voids in the North Galactic Cap greater than 10 h−1 Mpc in radius, covering 62% of the volume of the Universe up to that redshift range. These voids are populated by 8046 galaxies brighter than an absolute magnitude limit of Mr < − 20.09 (the volume-limited galaxy sample) and 79 947 void galaxies with r ≤ 17.6 and z < 0.088 (the magnitude-limited galaxy sample).
For the purpose of the present study, we use the magnitude-limited sample in order to have a statistically robust sample size, and applied a volume-limited sample selection to check and correct any observation bias in the results. Hereafter, we refer to this magnitude-limited galaxy sample as the Pan+12 sample. As we are interested in studying the morphology of void galaxies, we select galaxies in the redshift range of 0.005 ≤ z ≤ 0.080 to reduce uncertainties in the visual morphological classification, especially for fainter and/or smaller galaxies, which arise due to poor spatial resolution in SDSS images. This leaves us with 26 864 void galaxies in 174 voids (11 624 void galaxies in the volume-limited sample with Mr < −20.09 up to z = 0.08). Hereafter, we refer to this as the Voids174 sample. Figure 1 shows the spatial distribution of the voids in the Voids174 sample, where the void region is well delimited by denser large-scale structures, such as filaments and walls, with clusters found in the intersection of these.
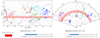 |
Fig. 1. Spatial distribution of voids in the Voids174 sample using an updated version of the LSSGalPy interactive 3D visualisation tools (Argudo-Fernández et al. 2017, Alcázar-Laynez et al. in prep.) publicly available at https://gitlab.com/astrogal. Only the voids within the redshift range 0.030 ≤ z ≤ 0.035 (left-hand panel) and within 20.05 deg ≤ Dec ≤ 25.05 deg (right-hand panel) are shown. Individual voids are represented in different colours. Galaxies in the large-scale structure in the same redshift and declination (Dec) range are represented by black points. To guide the eye, the red stripe in the left panel shows the selected Dec range in the wedge diagram, and the selected redshift range in the right ascension(RA)–Dec projection corresponding to the right panel. |
The sizes of the voids (Rvoid) are measured using the effective radius (reff), which represents the radius of voids when they are spherical or, in the case where the void is not spherical, the radius of the sphere that has the same volume as the non-spherical void. The voids have a median effective radius of 17.83 h−1 Mpc, with values ranging from 10 h−1 Mpc to 30 h−1 Mpc. We use the median value of the effective radius in the Pan+12 sample (17.83 h−1 Mpc) to separate our sample into small (61 voids, containing 6285 void galaxies) and large voids (113 voids, containing 20 579 void galaxies). This value is also in agreement with Hoyle & Vogeley (2002), who claim that voids have an average effective diameter of 29.5 h−1 Mpc (∼14.8 h−1 Mpc effective radius), and Rodríguez-Medrano et al. (2023), who identified large voids when their effective radius is larger than 18 h−1 Mpc. The left and right panels of Fig. 2 show the distributions of void effective radius and redshift for the void and void galaxies in the Voids174 sample, respectively. The same distributions for the Pan+12 sample are shown in green for comparison. The number of voids increases at higher redshift because the comoving volume spanned by the survey is larger.
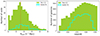 |
Fig. 2. Void size and redshift distributions for voids in the Pan+12 and the Voids174 samples. Left panel: Relative number of voids as a function of void size (Rvoid), determined using the effective radius, in units of h−1 Mpc. The green histogram represents the size distribution of voids in the Pan+12 sample (1055 voids) and the cyan histogram represents the size distribution of voids in the Voids174 sample (174 voids). The dashed red vertical line indicates the median value of the effective radius for the Pan+12 sample (17.83 h−1 Mpc). Right panel: Distribution of void galaxies as a function of redshift. The green histogram represents the distribution of void galaxies in the Pan+12 sample (79 947 galaxies) and the cyan histogram represents the distribution of void galaxies in the Voids174 sample (26 864 galaxies). |
In order to be able to compare the properties of the galaxies with respect to their position within the voids, we use the normalised distance from the void centre, which is calculated by dividing the void-centric distance by the size of the void r/Rvoid. Voids are in general spherical, but some of them may present a different shape (e.g. elliptical, ovoid, and elongated); therefore, the value r/Rvoid can be greater than one for the galaxies located outside the sphere with radius reff, as shown in Fig. 3. We note that the parameter r/Rvoid can potentially mix void galaxies that may belong to different internal void substructures (tendrils, groups, slight local overdensities) and/or may be closer to or farther from the surrounding wall, filament, or cluster. Nevertheless, the void-galaxy number density is constant and does not depend on r/Rvoid within the void environment; therefore the results of the present work are independent of void shape. The catalogue of voids in the Pan+12 sample does not contain information about the morphology of the void galaxies, and so we complete this information from the literature as described in Sect. 2.2.
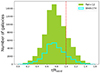 |
Fig. 3. Comparison between the normalised distance and the effective radius of each void (r/Rvoid) for void galaxies in Pan et al. (2012) (79 947 galaxies, green histogram) and for the subsample of void galaxies considered in the present study (26 864 galaxies, cyan histogram). The dashed red vertical line represents the maximum size of the voids if they were spherical. |
2.2. Galaxy morphology
As the Pan+12 sample is based on SDSS data, we use the morphology classification set out by Domínguez Sánchez et al. (2018) (hereafter DS18), who provide the largest and most accurate morphological catalogue of SDSS galaxies to date. In particular, these authors provide a deep-learning-based morphological classification for approximately 670 000 galaxies in SDSS-DR7. The models used in Domínguez Sánchez et al. (2018) were trained and tested using accurate existing visual classification catalogues from the Galaxy Zoo project3, in particular from the Galaxy Zoo 2 (GZ2, Willett et al. 2013) catalogue and the morphological classification by Nair & Abraham (2010).
The morphology of the galaxies in the DS18 catalogue is given through the numerical parameter ‘T-Type’, which ranges from −3 to 10, where T-Type ≤ 0 corresponds to early-type galaxies (i.e. E and S0), and positive values to late-type galaxies (i.e. Sa, Sb, Sc, Sd, and Sm), with T-Type = 10 denoting irregular galaxies4. The T-Type is a continuous morphology parameter related to the Hubble sequence (Hubble T), and the GZ2 classification, following the de Vaucouleurs (1963) morphology classification scheme. These correlations facilitate comparisons with different morphological classifications, and with previous studies, as presented below.
The DS18 catalogue contains morphological classification for 72 118 void galaxies in the Pan+12 catalogue (90% of the sample5), while the GZ2 catalogue only contains information for 41% of the Pan+12 catalogue. When we restrict our analysis to galaxies within our sample of 174 voids, there is morphology classification for 25 174 void galaxies out of 26 864 (94% of the sample). As shown in Fig. 4, the distribution of the T-Type parameter is similar between the Pan+12 and Voids174 samples, following a bimodal distribution for early- and late-type galaxies; however the Voids174 sample contains slightly more late-type galaxies, which is expected as the number of observable late-type galaxies decreases with redshift in magnitude-limited samples (the redshift completeness of the SDSS main spectroscopic sample is mr, Petrosian < 17.77 mag; Strauss et al. 2002).
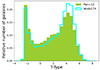 |
Fig. 4. Comparison between the T-Type morphological parameter in the DS18 catalogue for void galaxies in Pan et al. (2012) (72 118 galaxies, green histogram) and the subsample of void galaxies in this study (26 864 galaxies, cyan histogram). Negative values (T-type ≤ 0) correspond to early-type galaxies, while positive values (T-type > 0) correspond to late-type galaxies. |
3. Results
In this work, we investigate the effect of the large-scale environment of the Universe on the evolution of galaxies by analysing the morphology of galaxies inhabiting cosmic voids. In particular, we study the morphology of galaxies as a function of their void-centric distance and the size of the void in which they reside. In this section, we present our results. In Sect. 3.1, we analyse the morphological classification of void galaxies, and compare with other classifications available in the literature. In Sects. 3.2 and 3.3, we study the distribution of different galaxy-morphology types as a function of the distance from the centre of the void and the size of the void, respectively.
3.1. Morphology of void galaxies
As previously introduced, the DS18 catalogue provides morphology information for 25 174 of its 26 864 void galaxies (∼94% of the galaxies in the Voids174 sample). Of these, all the galaxies can be classified into early- or late-type galaxies using the T-Type parameter (as shown in Fig. 4). We find that 6335 void galaxies (25.2%) are classified as early-type (T-Type ≤ 0), while 18 839 void galaxies (74.8%) are classified as late-type (T-Type > 0). The fractions of early- and late-type galaxies (fEarly−type and fLate−type, respectively) are calculated considering the number of early- and late-type galaxies (as explained in Sect. 2.2) with respect to the total number of void galaxies with morphological classification (NT). Uncertainties are given considering a binomial distribution as  .
.
Table 1 shows comparison numbers using other galaxy morphology classifications, such as the morphological information from the GZ2 catalogue, which contains detailed morphology information for SDSS galaxies, as well as its first version, Galaxy Zoo 1 (GZ1 Lintott et al. 2008), which is the catalogue used by Ricciardelli et al. (2017). In addition, we computed the concentration index (CI = r90/r50 in the r-band, using photometric information for void galaxies from public SDSS data) for the void galaxies in the Voids174 sample in order to compare our results with those of Rodríguez-Medrano et al. (2023). The CI parameter correlates with galaxy morphology, where galaxies that are classified as early-type (E, S0, and Sa) by visual classification methods usually have values of CI > 2.6, and the late-type galaxies have lower values (Strateva et al. 2001). This parameter can be estimated for a large number of galaxies, except for some galaxies with flags in their r90 and/or r50 values (130 galaxies); however it is only a proxy for galaxy morphology and may lead to biases in the interpretation of the results. Indeed, the fraction of galaxies classified as early type using the CI parameter is higher than when using the DS18 catalogue (∼7% higher), which might be related to the fact that early-type galaxies using the CI value also include disk galaxies (Sa), while the DS18 classification only includes E and S0 galaxies in this category. To evaluate the consistency with different morphology classification when interpreting our results, we estimated the percentage of galaxies with the same morphology as in the DS18 catalogue (presented in the last column of Table 1). Even if the number of galaxies with a GZ1 classification is the lowest, the classification into early- and late-type galaxies is the most consistent with the DS18 classification. As expected, the percentage of galaxies classified as early type using the CI parameter and also classified as early type in the DS18 catalogue is the lowest (about 51%).
Void galaxies with morphology information.
3.2. Morphology of void galaxies as a function of void-centric distance
In this subsection, we study how galaxies are distributed according to their morphology in low-density environments, that is, in cosmic voids. In Fig. 5, we present the distribution of galaxies in the inner region of the voids as a function of their morphology according to the DS18 classification. We study this behaviour for the galaxies in the Voids174 sample, separating the sample into early- and late-type galaxies. In the left-hand panel of the figure, we show the distribution of early- and late-type galaxies as a function of distance from the void centre normalised to the void effective radius. In the right-hand panel, we show the fraction of early-type (fEarly−type) and late-type (fLate−type) galaxies, as defined in Sect. 3.1, following the same colour scheme. We see that, in general, the fLate−type is higher than the fEarly−type, and both fractions are nearly constant, with no significant differences, independently of the location of the galaxies within the voids. We discuss these results in Sect. 4.2.
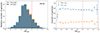 |
Fig. 5. Morphology of void galaxies as a function of void-centric distance. The dashed red vertical line represents the maximum size of the voids if they were spherical. Left: Relative number of early- (6225 galaxies, orange histogram) and late-type (18 839 galaxies, blue histogram) void galaxies. Right: Fraction of early- and late-type galaxies, with their corresponding errors. Early-type galaxies are shown in orange and late-type galaxies in blue. Orange and blue dotted horizontal lines indicate the mean fraction of early- and late-type galaxies, 25.2% and 74.8%, respectively, as presented in Table 1. We use bins of 0.10 r/Rvoid. The fraction of early-type galaxies has been shifted by 0.01 r/Rvoid so that the error bars do not overlap. |
3.3. Morphology of void galaxies as a function of void size
The last result of our work comes from the study of how galaxies of different morphology types are distributed in large and small voids. We divided the Voids174 sample into two subsamples of small and large voids. We used the median value of the void size for the Pan+12 sample (17.83 h−1 Mpc) as the threshold size separating large from small voids. The number of voids, and the total number of galaxies contained in small and large voids, are summarised in Table 2, including the number of early- and late-type galaxies according to their classification in the DS18 catalogue.
Numbers of small and large voids and void galaxies.
Additionally, Fig. 6 shows the fraction of early-type galaxies (fEarly−type, upper panel) and the fraction of late-type galaxies (fLate−type, lower panel) in each void as a function of its void size. Void size ranges from 9.85 h−1 Mpc to 33.92 h−1 Mpc. The dashed-red vertical line separates the small voids from the large ones. Thus, we can use this information to explore the abundances of early- and late-galaxies in both types of voids and compare them. In general, we do not observe any trend with void size, but there is a large scatter, which has a dependence on the redshift of the void. At a given void size, the fEarly−type increases with redshift, which is expected considering the magnitude-dependent Malmquist bias (Butkevich et al. 2005) that is implicit in the SDSS galaxy sample, which is limited to mr, Petrosian < 17.77 mag; this leads to the preferential detection of intrinsically bright, early-type galaxies. We checked that the fractions of early- and late-type galaxies are still almost constant and are independent of void size at different redshift bins and also considering an absolute magnitude volume-limited sample. We note that the void effective radius in Pan et al. (2012) is defined as the radius of a sphere with the equivalent volume of the void. Therefore, the results of the present study do not depend on the shape of the void. We discuss our results in Sect. 4.3.
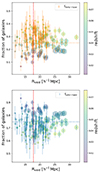 |
Fig. 6. Morphology of void galaxies as a function of void size. Fraction of early-type and late-type galaxies in each void as a function of its size (measured by its effective radius). Each data point corresponds to a single void in the Voids174 sample, in the upper panel for the fraction of early-type galaxies, and in the lower panel for the fraction of late-type galaxies, and thus for the same void fEarly − type + fLate − type = 1. The size of the circle around each data point is proportional to the number of galaxies in the corresponding void, with a minimum of 37 galaxies and a maximum of 622 galaxies. The colour of each circle corresponds to the redshift of the void according to the colour bar to the right side of each panel. The red dashed vertical line represents the median void size of 17.8 h−1 Mpc; meaning that small voids are located on the left-hand side of the plot and large voids on the right-hand side. Orange and blue dotted horizontal lines indicate the mean fraction of early- and late-type galaxies, 25.2% and 74.8% in the Voids174 sample, respectively, as presented in Table 1. |
4. Discussion
4.1. Morphology of void galaxies
As expected, the distribution of the morphology T-Type parameter shows a bimodal distribution (as shown in Fig. 4). Most of the galaxies in voids are late-type (Sa, Sb, Sc, Sd), with T-Type positive values (∼75%), and a smaller fraction are early-type (E and S0) galaxies, with T-Type ≤ 0 (∼25%). We obtain consistent results when using other morphology classifications (GZ2 and concentration index; see Table 1). The four morphological classifications show that there are more spiral galaxies than elliptical galaxies within voids. We note that the fraction of early-type galaxies using the GZ1 catalogue is much lower than the fraction of late-type galaxies, which might be due to the low completeness of the sample (a morphological classification is available for less than 36% of the sample). Therefore, in agreement with previous studies, late type is the predominant morphology in voids (Rojas et al. 2004; Ricciardelli et al. 2017; Florez et al. 2021; Conrado et al. 2024). We note that due to Malmquist bias, the fraction of late-type galaxies decreases with redshift, because only the brightest galaxies are observed. When considering the volume-limited sample of void galaxies, we find that the fraction of late-type galaxies (∼64%) is also larger than the fraction of early-type galaxies (∼36%), and therefore the results are not affected by this observing bias.
The morphology of galaxies in the Universe depends on the density of the environment: the low-density regions, known as voids, present a higher abundance of late-type galaxies than the high-density areas, such as clusters and filaments. More precisely, within the same redshift range as the galaxies in the Voids174 sample, and when removing all void galaxies, ∼62% of the galaxies in the DS18 sample are late-type galaxies, whereas ∼75% of the galaxies in voids in that sample are late-types; conversely, ∼38% of the non-void galaxies are early-type galaxies, whereas ∼25% of those in voids are early type. Therefore, there is a higher fraction of late-type galaxies in voids than in denser environments (filaments, walls, and clusters). This result is consistent with the morphology–density relation (Oemler 1974; Dressler 1980, 2011; Postman & Geller 1984; Goto et al. 2003; van der Wel et al. 2010; Houghton 2015; Pfeffer et al. 2023).
4.2. Morphology of void galaxies as a function of void-centric distance
Although late-type galaxies outnumber early-type galaxies, their distribution as a function of the normalised void-centric distance is similar. As shown in the left panel of Fig. 5, the total number of galaxies increases from the inner region of the voids up to a distance of r/Rvoid ≃ 0.75 , from where the number of void galaxies decreases down to zero in the outer regions of the voids. Despite this general trend, the fraction of early- and late-type galaxies is nearly constant up to a normalised distance of r/Rvoid ≲ 1.3 , with a median fLate−type ≃ 75% and a median fEarly−type ≃ 25% (as shown in the right panel of Fig. 5). There is a large dispersion with large error bars in the very inner and outer regions of the voids. This is due to the geometric effect that occurs in the centre of voids, where we find few galaxies because of the small volume of the void that we consider (normalised distance of ∼0.1), and the geometric effect at the edge of the voids due to the non-spherical shape (e.g. elliptical, ovoid, and elongated) of some voids (normalised distance > 1.2).
When looking at galaxies surrounding voids, Ricciardelli et al. (2017) found that the fraction of early-type galaxies increases from r/Rvoid = 0.8 to the outer region of the void (up to r/Rvoid = 2.5 ), which includes galaxies that may be outside of the voids, that is, galaxies belonging to filaments and walls (especially for the most spherical voids). According to the morphology–density relation, the number of early-type galaxies is larger in higher-density environments. When looking at the region inside voids, we find that the fractions of early- and late-type galaxies are nearly constant with respect to void-centric distance. However, the fLate−type is slightly higher than the median value within 0.1 < r/Rvoid < 0.6; conversely, the fEarly−type is slightly lower than the median value in that void-centric distance range. This excess of late-type galaxies is also observable when comparing the results with other morphological classifications (see Fig. 7), and when considering the volume-limited sample of void galaxies. This result might indicate that there is more cold gas falling into galaxies in the inner regions of voids, within r/Rvoid ≲ 0.5, favouring star-formation activity and therefore a larger fraction of late-type galaxies with respect to early-type galaxies. Therefore, the results presented here complete the general picture set out by previous studies.
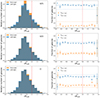 |
Fig. 7. Morphology of void galaxies as a function of void-centric distance using other morphology catalogues. Morphology of void galaxies with respect to the normalised effective radius of the voids, similarly to Fig. 5, but considering the GZ1 morphology catalogue (upper panel), the GZ2 morphology catalogue (middle panel), and the CI parameter (lower panel). The dashed red vertical line represents the edge of the voids if they were spherical. Left panels: Relative number of early- (orange histograms) and late-type (blue histograms) void galaxies. Right: Fraction of early- and late-type galaxies, with their corresponding errors. Early-type galaxies are shown in orange and late-type galaxies in blue. Orange and blue dash-dotted horizontal lines indicate the mean fraction of early- and late-type galaxies using the corresponding morphology catalogue, while dotted horizontal lines indicate the mean fraction of early- and late-type galaxies using the DS18 morphology, 25.2% and 74.8%, respectively, for comparison. We use bins of 0.10 r/Rvoid. The fraction of early-type galaxies has been shifted by +0.01 r/Rvoid so that the error bars do not overlap. |
It is worth noting that Ricciardelli et al. (2017) used the GZ1 morphological catalogue. According to our analysis, the completeness of this catalogue is low, where more than 60% of galaxies do not have a morphology classification (as shown in Table 1), and this might introduce additional uncertainties in the results. To check whether the results might be affected by the use of different morphological classifications, in Fig. 7 we repeated the same analysis as in Fig. 5 but using the GZ1 and GZ2 catalogues. We also used the CI parameter to compare with the results in Rodríguez-Medrano et al. (2023), which claim that the concentration index of galaxies increases from the centre of the voids to a distance of r/Rvoid ≲ 0.8 (with a mean CI parameter of ∼2.30, considering uncertainties), from where the CI is nearly constant at a mean value of ∼2.5, up to r/Rvoid = 4 . It is important to note that the profile presented by these latter authors does not show mean CI values of greater than 2.6 (i.e., early-type galaxies). We reanalysed our data sample specifically for comparison with Rodríguez-Medrano et al. (2023); the results are also presented in Fig. 7. We obtained similar results to when using the DS18 morphology catalogue. Although the fractions of early- and late-type galaxies in voids are different depending on the morphology catalogue used, the trends with the void-centric distance remain nearly constant when using the CI parameter.
It is important to note that the sample of voids used by Ricciardelli et al. (2017) and Rodríguez-Medrano et al. (2023) is also based on SDSS data, with voids selected using volume-limited samples of galaxies, but using different void-finder algorithms. In addition, Ricciardelli et al. (2017) used the catalogue of voids compiled by Varela et al. (2012), who provide a catalogue of galaxies in shells around voids, not inside voids. As the catalogue of Pan et al. (2012) only contains galaxies within voids, we cannot extend the sample to also cover galaxies around voids in order to perform a qualitative comparison, and therefore the results of this work are presented as a complement to previous studies.
4.3. Morphology of void galaxies as a function of void size
We did not find a significant difference between the fractions of early- and late-type galaxies in relation to the size of the void in which they reside (see Fig. 6). As shown in Table 2, the fractions of early-type galaxies in small and large voids are similar to the fractions measured considering the galaxies within all the voids in the Voids174 sample (fEarly−type ∼ 25%). Our results complement the results in Ricciardelli et al. (2017), who found that the surroundings of small voids host an excess of early-type galaxies and show a lack of late-type galaxies relative to their larger counterparts, which are preferably surrounded by late-type galaxies according to these authors. As we point out in Sect. 4.2, Ricciardelli et al. (2017) studied the dependence of the fraction of early-type galaxies as a function of void size in the areas surrounding voids, that is, in the outermost zone of the voids up to r/Rvoid = 2.5 , which might also include galaxies belonging to filaments and walls. In the present study, we focus on galaxies within voids, avoiding the walls surrounding them. We note that the small voids in Ricciardelli et al. (2017) are much smaller (median value in the range 11.3–11.5 h−1 Mpc) than the smallest void in the Voids174 sample. The smallest void in the Voids174 sample has an effective radius of 11.6 h−1 Mpc, and therefore all the galaxies of our voids sample belong to large voids according to their classification. We note that, by definition, the VoidFinder algorithm used to build the Pan+12 void catalogue applied a cut-off of 10 h−1 Mpc for the minimum radius of a void region, as explained in Sect. 2.1.
As can be observed in Fig. 6, there is a large scatter around the global fEarly−type in the Voids174 sample within small (left of the dashed-red vertical line) and large (right of the dashed-red vertical line) voids. In particular, the scatter is larger (up to 0.4 in relative number of galaxies) in voids with a lower number of galaxies (indicated by smaller circles) than in voids with more galaxies (indicated by larger circles). This trend holds throughout the range of void sizes. The scatter in the plot is expected, because, statistically, the estimation of the fraction of early- and late-type galaxies might be affected when there is a low number of galaxies, showing extreme values of the fractions. In addition, as mentioned in Sect. 3.3, the scatter has a dependence on the redshift of the void, where at a given void size the fEarly−type increases with redshift. We verified that our results are consistent at different redshift bins and also considering an absolute-magnitude volume-limited sample. The dispersion observed in Fig. 6, together with the trend observed in the fEarly−type for voids with a low number of galaxies, motivates the analysis of the morphology of galaxies located in voids in terms of a new physical parameter for voids: the number density of galaxies (ρN), defined as the number of galaxies inhabiting a void (ngalaxies), divided by the total volume of the void:
 (1)
(1)
in units of gal/(h−1 Mpc)3, where ngalaxies is the number of galaxies in the void and Rvoid is the effective radius of the void. Therefore, the galaxy number density is a statistically robust parameter even with a low number of void galaxies, as it not only considers how many galaxies are in the void, but also the projected distance to their near-neighbour galaxies as a function of the size of the void; it therefore allows a better understanding of the local environment of the galaxies within the void. In voids with a lower number density, their galaxies are more isolated – even if the void is small – if the projected separations between galaxies are large. In addition, the mean dispersion in the fraction of early- and late-type galaxies when using the number density is smaller (0.05 in units of fraction of galaxies) than when considering the void size (0.07 in units of fraction of galaxies).
When exploring the dependency of the morphology of the void galaxies on the number density of the galaxies in the void, we initially find a decreasing trend for early-type galaxies, and an increasing trend with late-type galaxies. As shown in the left-hand panels in Fig. 8, the fraction of early-type galaxies in the less dense voids is about 5% higher than the mean fraction in the Void174 sample, and decreases with the number density of the void. Conversely, the fraction of late-type galaxies increases with increasing galaxy number density. However, these trends are not present when considering the absolute-magnitude volume-limited sample. This is because there is a dependency of the galaxy number density on redshift due to the Malmquist bias. Using a volume-limited sample of galaxies, we find no dependency of the morphology of the void galaxies on the number density of void galaxies. However, the galaxy number density shows values concentrated between 0.0005 and 0.0040 [gal/(h−1 Mpc)3] due to the low number of galaxies considered. This introduces a large scatter in the fraction of early-type galaxies. In addition, the volume-limited sample of void galaxies contains only galaxies brighter than Mr = −20.09, which favours the inclusion of early-type galaxies (which are typically brighter), and leads to an under-representation of faint galaxies for the voids at higher redshift. This is particularly critical in voids, considering that void galaxies are, in general, less massive and bluer than galaxies in denser environments. For these reasons, instead of analysing a volume-limited sample, we chose to apply over-density corrections to the galaxy number density for the full sample, which removes its dependency on redshift without loosing galaxies. We adapt the methodology in Etherington & Thomas (2015) to estimate the overdensity for the void-galaxy number density, δ, defined as
 (2)
(2)
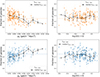 |
Fig. 8. Morphology of void galaxies as a function of void galaxy number density. Fraction of early- (upper panels) and late-type (lower panels) galaxies in each void as a function of its galaxy number density (left panels) and the over-density-corrected number density (right panels). Each data point corresponds to the fraction of early-type galaxies (orange) and the fraction of late-type galaxies (blue) in each void. The black points and error bars indicate the median values and the corresponding 1σ dispersion in eight bins of ρN = 0.002 gal/(h−1 Mpc)3 (left) and nine bins of log 10(1+δ) = 0.1 (right). The orange and blue dotted horizontal lines indicate the mean fraction of early- and late-type galaxies, 25.2% and 74.8%, respectively, in the Voids174 sample, as presented in Table 1. |
where  is the mean galaxy number density for voids within redshift bins of z = 0.01. The overdensity-corrected void galaxy number density is then expressed in the form of log 10(1+ δ). As shown in the right-hand panels of Fig. 8, the fraction of early- and late-type galaxies has no dependency on the over-density-corrected number density of the void.
In summary, we find that the density of galaxies in the void does not have an impact on the morphology of the void galaxies. Thus, void galaxies do not follow the morphology–density relation within the void environment. One interpretation could be that the galaxy number densities within voids are so low that the threshold at which the morphology–density relation is triggered is not yet reached. Specifically, the physical processes (secular evolution, mergers, interactions, ram pressure stripping, etc, Argudo-Fernández et al. 2018) responsible for the evolution from late to earlier types (such as external environmental quenching) are not sufficiently effective in voids or are so slow (internal secular quenching) that their contributions do not appear in the morphology–density relation.
5. Summary and conclusions
In this work, we investigate the effect of the large-scale environment of the Universe on the evolution of galaxies by analysing the morphology of galaxies inhabiting cosmic voids. In particular, we study the morphology of galaxies as a function of void-centric distance and void size.
The sample of void galaxies that we use in this study is based on the catalogue of cosmic voids and void galaxies compiled by Pan et al. (2012) based on photometric and spectroscopic data from the SDSS-DR7. We selected galaxies in the redshift range of 0.005 ≤ z ≤ 0.080 to reduce uncertainties in the visual morphological classification, which are due to poor spatial resolution. This leaves us with 26 864 void galaxies in 174 voids. We measured the sizes of the voids (Rvoid) using the effective radius (radius of voids when they are spherical or, in the case where the void is not spherical, the radius of the sphere that has the same volume as the non-spherical void). We use the median value of Rvoid in Pan et al. (2012) (17.83 h−1 Mpc) to separate our sample into small (61 voids, containing 6285 void galaxies) and large (113 voids, containing 20 579 void galaxies) voids.
We classify galaxies into early- and late type using the morphology classification by Domínguez Sánchez et al. (2018), who combined accurate existing visual classification catalogues with machine learning techniques, providing the largest and most accurate morphological catalogue to date for galaxies in the SDSS. We find that 6335 void galaxies (25.2%) are classified as early type (E and S0), while 18 839 (74.8%) are classified as late type (Sa, Sb, Sc, Sd). We obtain consistent results when using other morphology classifications. We analysed the morphological distributions of these galaxies inside the voids by exploring how the galaxies are distributed within the voids as a function of the normalised void-centric distance, and how the galaxies are distributed as a function of their size and their number density in voids, with this latter defined as the number of galaxies inhabiting a void divided by the total volume of the void. Our main findings are as follows:
-
In agreement with previous studies, late type is the predominant morphology for galaxies in voids. The morphology of galaxies in the Universe depends on the density of the environment: the low-density regions, known as voids, present a higher abundance of late-type galaxies than the high-density areas, such as clusters and filaments. This result is consistent with the morphology–density relation.
-
Although the number of late-type galaxies is larger than the number of early-type galaxies in voids, their distribution as a function of the normalised void-centric distance is similar. The fractions of early- and late-type galaxies are generally constant in the inner part of the voids up to a normalised distance of ∼1.2 (∼75% late- and ∼25% early-types). We also do not find any dependence of the fractions of early- and late-type galaxies on the size of the voids. Therefore, the morphology of void galaxies is independent of their location, and is also independent of the size of the void in which they reside.
-
In addition, there is no dependence of the fractions of early- and late-type galaxies on the number density of galaxies in voids. Therefore, we find no difference between voids of lower or higher volume number density of galaxies in terms of their early- and late-type galaxy populations.
Our results complement previous studies. Rodríguez-Medrano et al. (2023) found that the concentration index of galaxies (as a proxy of galaxy morphology) increases from the centre of the voids to a void-centric distance of r/Rvoid ≲ 0.8 . In addition, Ricciardelli et al. (2017) found that the fraction of early-type galaxies increases from r/Rvoid = 0.8 to the outer region of the void (up to r/Rvoid =2.5 ), while we find that the fractions of early- and late-type galaxies are nearly constant with respect to the void-centric distance within the void, with a moderate excess of late-type galaxies within 0.1 < r/Rvoid < 0.6. This might indicate that there is more cold gas falling into galaxies in the inner (r/Rvoid ≲ 0.5 ) region of the voids. Ricciardelli et al. (2017) also found that the surroundings of small voids host an excess of early-type galaxies and a lack of late-type galaxies relative to their larger counterparts. In contrast, large voids are more likely to be surrounded by late-type galaxies according to these authors.
We conclude that, overall, galaxies in voids follow the morphology–density relation, in the sense that the majority of the galaxies in voids (the most under-dense large-scale environments) are late-type galaxies. However, we find no difference between voids with lower and higher galaxy number density in terms of their early- and late-type populations. The physical processes responsible for the evolution from late to earlier types (such as external environmental quenching) are not sufficiently effective in voids or are so slow (internal secular quenching) that their contributions cannot be seen in the morphology–density relation.
R-type voids are those in expansion at all scales, while S-type voids are those expanding at their inner regions but collapsing at larger scales; see Ceccarelli et al. (2013) for further details.
A void galaxy is a galaxy that resides in a void region, whereas wall galaxies reside in filaments and clusters.
We note that it is not trivial to relate the T-Type parameter, as defined in DS18, with the historical Hubble type morphological definition for spiral galaxies (Sa, Sb, Sc, Sd, and Sm), considering than less than 1% of galaxies in DS18 have T-Type > 6.
We note that the DS18 catalogue does not contain morphological classification for all the galaxies in the SDSS but for a large fraction of the SDSS spectroscopic main galaxy sample.
Acknowledgments
The authors thank the anonymous referee for the thorough reading and constructive feedback. This paper is partially based on data obtained by the CAVITY project, funded by the Spanish Ministry of Science and Innovation under grants PID2020-113689GB-I00 and PID2023.149578NB.I00 as well as by Consejería de Universidad, Investigación e Innovación and Gobierno de España and Unión Europea – NextGenerationEU through grant AST22_4.4. We acknowledge financial support by the research project PID2020-114414GB-I00, financed by MCIN/AEI/10.13039/501100011033, the project A-FQM-510-UGR20 financed from FEDER/Junta de Andalucía-Consejería de Transforamción Económica, Industria, Conocimiento y Universidades/Proyecto and by the grants P20_00334 and FQM108, financed by the Junta de Andalucía (Spain). M.A-F. acknowledges support from ANID FONDECYT iniciación project 11200107 and the Emergia program (EMERGIA20_38888) from Consejería de Universidad, Investigación e Innovación de la Junta de Andalucía. S.D.P. acknowledges financial support from Juan de la Cierva Formación fellowship (FJC2021-047523-I) financed by MCIN/AEI/10.13039/501100011033 and by the European Union “NextGenerationEU”/PRTR, Ministerio de Economía y Competitividad under grant PID2019-107408GB-C44 and PID2022-136598NB-C32, and also from the Fonds de Recherche du Québec – Nature et Technologies. DE acknowledges support from a Beatriz Galindo senior fellowship (BG20/00224) from the Spanish Ministry of Science and Innovation. LSM acknowledges support from Juan de la Cierva fellowship (IJC2019-041527-I). Funding for SDSS-III has been provided by the Alfred P. Sloan Foundation, the Participating Institutions, the National Science Foundation, and the U.S. Department of Energy Office of Science. The SDSS-III web site is http://www.sdss3.org/. SDSS-III is managed by the Astrophysical Research Consortium for the Participating Institutions of the SDSS-III Collaboration including the University of Arizona, the Brazilian Participation Group, Brookhaven National Laboratory, Carnegie Mellon University, University of Florida, the French Participation Group, the German Participation Group, Harvard University, the Instituto de Astrofisica de Canarias, the Michigan State/Notre Dame/JINA Participation Group, Johns Hopkins University, Lawrence Berkeley National Laboratory, Max Planck Institute for Astrophysics, Max Planck Institute for Extraterrestrial Physics, New Mexico State University, New York University, Ohio State University, Pennsylvania State University, University of Portsmouth, Princeton University, the Spanish Participation Group, University of Tokyo, University of Utah, Vanderbilt University, University of Virginia, University of Washington, and Yale University. This research made use of Astropy, a community-developed core Python (http://www.python.org) package for Astronomy (Astropy Collaboration 2013, 2018); ipython (Pérez & Granger 2007); matplotlib (Hunter 2007); SciPy, a collection of open source software for scientific computing in Python (Virtanen et al. 2020); pandas, an open source data analysis and manipulation tool (pandas development team 2020; Wes McKinney 2010); and NumPy, a structure for efficient numerical computation (van der Walt et al. 2011).
References
- Abazajian, K. N., Adelman-McCarthy, J. K., & Agüeros, M. A. 2009, ApJS, 182, 543 [NASA ADS] [CrossRef] [Google Scholar]
- Ahumada, R., Allende Prieto, C., Almeida, A., et al. 2020, ApJS, 249, 3 [NASA ADS] [CrossRef] [Google Scholar]
- Argudo-Fernández, M., Duarte Puertas, S., Ruiz, J. E., et al. 2017, PASP, 129, 058005 [CrossRef] [Google Scholar]
- Argudo-Fernández, M., Lacerna, I., & Duarte Puertas, S. 2018, A&A, 620, A113 [NASA ADS] [CrossRef] [EDP Sciences] [Google Scholar]
- Astropy Collaboration (Robitaille, T. P., et al.) 2013, A&A, 558, A33 [NASA ADS] [CrossRef] [EDP Sciences] [Google Scholar]
- Astropy Collaboration (Price-Whelan, A. M., et al.) 2018, AJ, 156, 123 [Google Scholar]
- Benson, A. J., Hoyle, F., Torres, F., & Vogeley, M. S. 2003, MNRAS, 340, 160 [NASA ADS] [CrossRef] [Google Scholar]
- Beygu, B., Kreckel, K., van der Hulst, J. M., et al. 2016, MNRAS, 458, 394 [NASA ADS] [CrossRef] [Google Scholar]
- Beygu, B., Peletier, R. F., van der Hulst, J. M., et al. 2017, MNRAS, 464, 666 [NASA ADS] [CrossRef] [Google Scholar]
- Blanton, M. R., Schlegel, D. J., Strauss, M. A., et al. 2005, AJ, 129, 2562 [NASA ADS] [CrossRef] [Google Scholar]
- Bond, J. R., Kofman, L., & Pogosyan, D. 1996, Nature, 380, 603 [NASA ADS] [CrossRef] [Google Scholar]
- Butkevich, A. G., Berdyugin, A. V., & Teerikorpi, P. 2005, MNRAS, 362, 321 [NASA ADS] [CrossRef] [Google Scholar]
- Ceccarelli, L., Padilla, N., & Lambas, D. G. 2008, MNRAS, 390, L9 [NASA ADS] [Google Scholar]
- Ceccarelli, L., Paz, D., Lares, M., Padilla, N., & Lambas, D. G. 2013, MNRAS, 434, 1435 [NASA ADS] [CrossRef] [Google Scholar]
- Choi, Y.-Y., Han, D.-H., & Kim, S.-S. S. 2010, J. Korean Astron. Soc., 43, 191 [NASA ADS] [CrossRef] [Google Scholar]
- Conrado, A. M., González Delgado, R. M., García-Benito, R., et al. 2024, A&A, 687, A98 [NASA ADS] [CrossRef] [EDP Sciences] [Google Scholar]
- Croton, D. J., Farrar, G. R., Norberg, P., et al. 2005, MNRAS, 356, 1155 [NASA ADS] [CrossRef] [Google Scholar]
- Das, M., Saito, T., Iono, D., Honey, M., & Ramya, S. 2015, ApJ, 815, 40 [NASA ADS] [CrossRef] [Google Scholar]
- de Vaucouleurs, G. 1963, ApJS, 8, 31 [NASA ADS] [CrossRef] [Google Scholar]
- Domínguez Sánchez, H., Huertas-Company, M., Bernardi, M., Tuccillo, D., & Fischer, J. L. 2018, MNRAS, 476, 3661 [Google Scholar]
- Domínguez-Gómez, J., Lisenfeld, U., Pérez, I., et al. 2022, A&A, 658, A124 [NASA ADS] [CrossRef] [EDP Sciences] [Google Scholar]
- Domínguez-Gómez, J., Pérez, I., Ruiz-Lara, T., et al. 2023a, A&A, 680, A111 [NASA ADS] [CrossRef] [EDP Sciences] [Google Scholar]
- Domínguez-Gómez, J., Pérez, I., Ruiz-Lara, T., et al. 2023b, Nature, 619, 269 [CrossRef] [Google Scholar]
- Dressler, A. 1980, ApJ, 236, 351 [Google Scholar]
- Dressler, A. 2011, Astrophys. Space Sci. Proc., 27, 1 [NASA ADS] [Google Scholar]
- El-Ad, H., Piran, T., & Dacosta, L. N. 1997, MNRAS, 287, 790 [NASA ADS] [CrossRef] [Google Scholar]
- Etherington, J., & Thomas, D. 2015, MNRAS, 451, 660 [NASA ADS] [CrossRef] [Google Scholar]
- Florez, J., Berlind, A. A., Kannappan, S. J., et al. 2021, ApJ, 906, 97 [NASA ADS] [CrossRef] [Google Scholar]
- Goto, T., Yamauchi, C., Fujita, Y., et al. 2003, MNRAS, 346, 601 [NASA ADS] [CrossRef] [Google Scholar]
- Grogin, N. A., & Geller, M. J. 1999, AJ, 118, 2561 [NASA ADS] [CrossRef] [Google Scholar]
- Grogin, N. A., & Geller, M. J. 2000, AJ, 119, 32 [NASA ADS] [CrossRef] [Google Scholar]
- Habouzit, M., Pisani, A., Goulding, A., et al. 2020, MNRAS, 493, 899 [NASA ADS] [CrossRef] [Google Scholar]
- Hahn, O., Carollo, C. M., Porciani, C., & Dekel, A. 2007, MNRAS, 381, 41 [NASA ADS] [CrossRef] [Google Scholar]
- Houghton, R. C. W. 2015, MNRAS, 451, 3427 [Google Scholar]
- Hoyle, F., & Vogeley, M. S. 2002, ApJ, 566, 641 [NASA ADS] [CrossRef] [Google Scholar]
- Hoyle, F., Rojas, R. R., Vogeley, M. S., & Brinkmann, J. 2005, ApJ, 620, 618 [NASA ADS] [CrossRef] [Google Scholar]
- Hoyle, F., Vogeley, M. S., & Pan, D. 2012, MNRAS, 426, 3041 [NASA ADS] [CrossRef] [Google Scholar]
- Hunter, J. D. 2007, Comput. Sci. Eng., 9, 90 [NASA ADS] [CrossRef] [Google Scholar]
- Jaber, M., Peper, M., Hellwing, W. A., Aragón-Calvo, M. A., & Valenzuela, O. 2024, MNRAS, 527, 4087 [Google Scholar]
- Kreckel, K., Croxall, K., Groves, B., van de Weygaert, R., & Pogge, R. W. 2015, ApJ, 798, L15 [Google Scholar]
- Kuhn, B., Hopp, U., & Elsaesser, H. 1997, A&A, 318, 405 [NASA ADS] [Google Scholar]
- Lares, M., Luparello, H. E., Maldonado, V., et al. 2017, MNRAS, 470, 85 [NASA ADS] [CrossRef] [Google Scholar]
- Li, G., Ma, Y.-Z., Tramonte, D., & Li, G.-L. 2024, MNRAS, 527, 2663 [Google Scholar]
- Lintott, C. J., Schawinski, K., Slosar, A., et al. 2008, MNRAS, 389, 1179 [NASA ADS] [CrossRef] [Google Scholar]
- Liu, C.-X., Pan, D. C., Hao, L., et al. 2015, ApJ, 810, 165 [NASA ADS] [CrossRef] [Google Scholar]
- Mao, Q., Berlind, A. A., Scherrer, R. J., et al. 2017, ApJ, 835, 161 [NASA ADS] [CrossRef] [Google Scholar]
- McKinney, W. 2010, Proceedings of the 9th Python in Science Conference, 56 [CrossRef] [Google Scholar]
- Moorman, C. M., Moreno, J., White, A., et al. 2016, ApJ, 831, 118 [NASA ADS] [CrossRef] [Google Scholar]
- Nair, P. B., & Abraham, R. G. 2010, ApJS, 186, 427 [Google Scholar]
- Oemler, A., Jr. 1974, ApJ, 194, 1 [NASA ADS] [CrossRef] [Google Scholar]
- Padilla, N., Lambas, D. G., & González, R. 2010, MNRAS, 409, 936 [NASA ADS] [CrossRef] [Google Scholar]
- Pan, D. C., Vogeley, M. S., Hoyle, F., Choi, Y.-Y., & Park, C. 2012, MNRAS, 421, 926 [NASA ADS] [CrossRef] [Google Scholar]
- pandas development team, T. 2020, https://doi.org/10.5281/zenodo.3509134 [Google Scholar]
- Patiri, S. G., Prada, F., Holtzman, J., Klypin, A., & Betancort-Rijo, J. 2006, MNRAS, 372, 1710 [NASA ADS] [CrossRef] [Google Scholar]
- Pérez, F., & Granger, B. E. 2007, Comput. Sci. Eng., 9, 21 [Google Scholar]
- Pfeffer, J., Cavanagh, M. K., Bekki, K., et al. 2023, MNRAS, 518, 5260 [Google Scholar]
- Popescu, C. C., Hopp, U., & Elsaesser, H. 1997, A&A, 325, 881 [NASA ADS] [Google Scholar]
- Porter, L. E., Holwerda, B. W., Kruk, S., et al. 2023, MNRAS, 524, 5768 [NASA ADS] [CrossRef] [Google Scholar]
- Postman, M., & Geller, M. J. 1984, ApJ, 281, 95 [Google Scholar]
- Pustilnik, S. A., Martin, J. M., Huchtmeier, W. K., et al. 2002, A&A, 389, 405 [NASA ADS] [CrossRef] [EDP Sciences] [Google Scholar]
- Pustilnik, S. A., Tepliakova, A. L., & Kniazev, A. Y. 2011, Astrophys. Bull., 66, 255 [NASA ADS] [CrossRef] [Google Scholar]
- Ricciardelli, E., Cava, A., Varela, J., & Tamone, A. 2017, ApJ, 846, L4 [NASA ADS] [CrossRef] [Google Scholar]
- Rodríguez-Medrano, A. M., Paz, D. J., Stasyszyn, F. A., et al. 2023, MNRAS, 521, 916 [CrossRef] [Google Scholar]
- Rojas, R. R., Vogeley, M. S., Hoyle, F., & Brinkmann, J. 2004, ApJ, 617, 50 [NASA ADS] [CrossRef] [Google Scholar]
- Rosas-Guevara, Y., Tissera, P., Lagos, C. d. P., Paillas, E., & Padilla, N. 2022, MNRAS, 517, 712 [NASA ADS] [CrossRef] [Google Scholar]
- Strateva, I., Ivezić, Ž., Knapp, G. R., et al. 2001, AJ, 122, 1861 [CrossRef] [Google Scholar]
- Strauss, M. A., Weinberg, D. H., Lupton, R. H., et al. 2002, AJ, 124, 1810 [Google Scholar]
- Szomoru, A., van Gorkom, J. H., Gregg, M. D., & Strauss, M. A. 1996, AJ, 111, 2150 [NASA ADS] [CrossRef] [Google Scholar]
- Tikhonov, A. V., & Klypin, A. 2009, MNRAS, 395, 1915 [NASA ADS] [CrossRef] [Google Scholar]
- van de Weygaert, R., & Platen, E. 2011, Int. J. Mod. Phys. Conf. Ser., 1, 41 [NASA ADS] [CrossRef] [Google Scholar]
- van der Walt, S., Colbert, S. C., & Varoquaux, G. 2011, Comput. Sci. Eng., 13, 22 [Google Scholar]
- van der Wel, A., Bell, E. F., Holden, B. P., Skibba, R. A., & Rix, H.-W. 2010, ApJ, 714, 1779 [NASA ADS] [CrossRef] [Google Scholar]
- Varela, J., Betancort-Rijo, J., Trujillo, I., & Ricciardelli, E. 2012, ApJ, 744, 82 [NASA ADS] [CrossRef] [Google Scholar]
- Virtanen, P., Gommers, R., Oliphant, T. E., et al. 2020, Nat. Meth., 17, 261 [Google Scholar]
- Willett, K. W., Lintott, C. J., Bamford, S. P., et al. 2013, MNRAS, 435, 2835 [Google Scholar]
All Tables
All Figures
|
Fig. 1. Spatial distribution of voids in the Voids174 sample using an updated version of the LSSGalPy interactive 3D visualisation tools (Argudo-Fernández et al. 2017, Alcázar-Laynez et al. in prep.) publicly available at https://gitlab.com/astrogal. Only the voids within the redshift range 0.030 ≤ z ≤ 0.035 (left-hand panel) and within 20.05 deg ≤ Dec ≤ 25.05 deg (right-hand panel) are shown. Individual voids are represented in different colours. Galaxies in the large-scale structure in the same redshift and declination (Dec) range are represented by black points. To guide the eye, the red stripe in the left panel shows the selected Dec range in the wedge diagram, and the selected redshift range in the right ascension(RA)–Dec projection corresponding to the right panel. |
| In the text | |
|
Fig. 2. Void size and redshift distributions for voids in the Pan+12 and the Voids174 samples. Left panel: Relative number of voids as a function of void size (Rvoid), determined using the effective radius, in units of h−1 Mpc. The green histogram represents the size distribution of voids in the Pan+12 sample (1055 voids) and the cyan histogram represents the size distribution of voids in the Voids174 sample (174 voids). The dashed red vertical line indicates the median value of the effective radius for the Pan+12 sample (17.83 h−1 Mpc). Right panel: Distribution of void galaxies as a function of redshift. The green histogram represents the distribution of void galaxies in the Pan+12 sample (79 947 galaxies) and the cyan histogram represents the distribution of void galaxies in the Voids174 sample (26 864 galaxies). |
| In the text | |
|
Fig. 3. Comparison between the normalised distance and the effective radius of each void (r/Rvoid) for void galaxies in Pan et al. (2012) (79 947 galaxies, green histogram) and for the subsample of void galaxies considered in the present study (26 864 galaxies, cyan histogram). The dashed red vertical line represents the maximum size of the voids if they were spherical. |
| In the text | |
|
Fig. 4. Comparison between the T-Type morphological parameter in the DS18 catalogue for void galaxies in Pan et al. (2012) (72 118 galaxies, green histogram) and the subsample of void galaxies in this study (26 864 galaxies, cyan histogram). Negative values (T-type ≤ 0) correspond to early-type galaxies, while positive values (T-type > 0) correspond to late-type galaxies. |
| In the text | |
|
Fig. 5. Morphology of void galaxies as a function of void-centric distance. The dashed red vertical line represents the maximum size of the voids if they were spherical. Left: Relative number of early- (6225 galaxies, orange histogram) and late-type (18 839 galaxies, blue histogram) void galaxies. Right: Fraction of early- and late-type galaxies, with their corresponding errors. Early-type galaxies are shown in orange and late-type galaxies in blue. Orange and blue dotted horizontal lines indicate the mean fraction of early- and late-type galaxies, 25.2% and 74.8%, respectively, as presented in Table 1. We use bins of 0.10 r/Rvoid. The fraction of early-type galaxies has been shifted by 0.01 r/Rvoid so that the error bars do not overlap. |
| In the text | |
|
Fig. 6. Morphology of void galaxies as a function of void size. Fraction of early-type and late-type galaxies in each void as a function of its size (measured by its effective radius). Each data point corresponds to a single void in the Voids174 sample, in the upper panel for the fraction of early-type galaxies, and in the lower panel for the fraction of late-type galaxies, and thus for the same void fEarly − type + fLate − type = 1. The size of the circle around each data point is proportional to the number of galaxies in the corresponding void, with a minimum of 37 galaxies and a maximum of 622 galaxies. The colour of each circle corresponds to the redshift of the void according to the colour bar to the right side of each panel. The red dashed vertical line represents the median void size of 17.8 h−1 Mpc; meaning that small voids are located on the left-hand side of the plot and large voids on the right-hand side. Orange and blue dotted horizontal lines indicate the mean fraction of early- and late-type galaxies, 25.2% and 74.8% in the Voids174 sample, respectively, as presented in Table 1. |
| In the text | |
|
Fig. 7. Morphology of void galaxies as a function of void-centric distance using other morphology catalogues. Morphology of void galaxies with respect to the normalised effective radius of the voids, similarly to Fig. 5, but considering the GZ1 morphology catalogue (upper panel), the GZ2 morphology catalogue (middle panel), and the CI parameter (lower panel). The dashed red vertical line represents the edge of the voids if they were spherical. Left panels: Relative number of early- (orange histograms) and late-type (blue histograms) void galaxies. Right: Fraction of early- and late-type galaxies, with their corresponding errors. Early-type galaxies are shown in orange and late-type galaxies in blue. Orange and blue dash-dotted horizontal lines indicate the mean fraction of early- and late-type galaxies using the corresponding morphology catalogue, while dotted horizontal lines indicate the mean fraction of early- and late-type galaxies using the DS18 morphology, 25.2% and 74.8%, respectively, for comparison. We use bins of 0.10 r/Rvoid. The fraction of early-type galaxies has been shifted by +0.01 r/Rvoid so that the error bars do not overlap. |
| In the text | |
|
Fig. 8. Morphology of void galaxies as a function of void galaxy number density. Fraction of early- (upper panels) and late-type (lower panels) galaxies in each void as a function of its galaxy number density (left panels) and the over-density-corrected number density (right panels). Each data point corresponds to the fraction of early-type galaxies (orange) and the fraction of late-type galaxies (blue) in each void. The black points and error bars indicate the median values and the corresponding 1σ dispersion in eight bins of ρN = 0.002 gal/(h−1 Mpc)3 (left) and nine bins of log 10(1+δ) = 0.1 (right). The orange and blue dotted horizontal lines indicate the mean fraction of early- and late-type galaxies, 25.2% and 74.8%, respectively, in the Voids174 sample, as presented in Table 1. |
| In the text | |
Current usage metrics show cumulative count of Article Views (full-text article views including HTML views, PDF and ePub downloads, according to the available data) and Abstracts Views on Vision4Press platform.
Data correspond to usage on the plateform after 2015. The current usage metrics is available 48-96 hours after online publication and is updated daily on week days.
Initial download of the metrics may take a while.