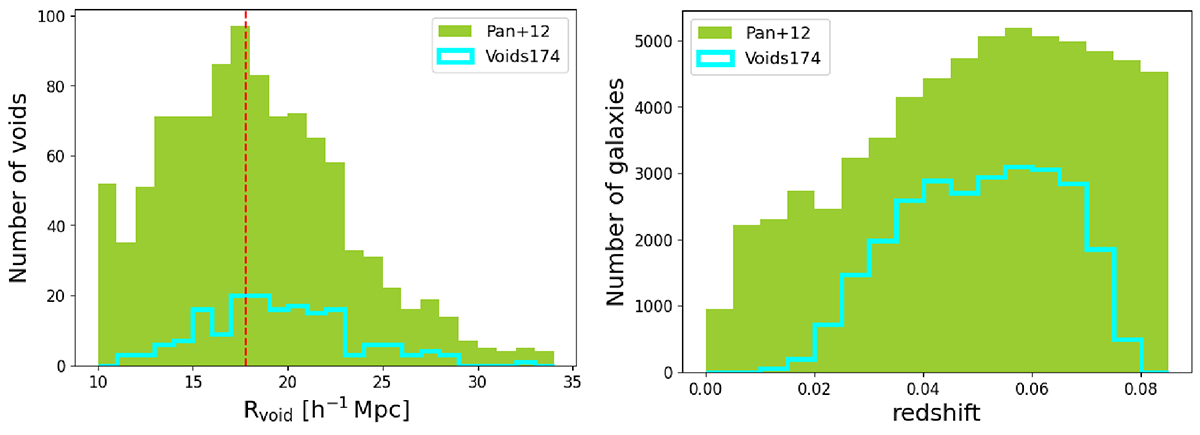
Fig. 2.
Download original image
Void size and redshift distributions for voids in the Pan+12 and the Voids174 samples. Left panel: Relative number of voids as a function of void size (Rvoid), determined using the effective radius, in units of h−1 Mpc. The green histogram represents the size distribution of voids in the Pan+12 sample (1055 voids) and the cyan histogram represents the size distribution of voids in the Voids174 sample (174 voids). The dashed red vertical line indicates the median value of the effective radius for the Pan+12 sample (17.83 h−1 Mpc). Right panel: Distribution of void galaxies as a function of redshift. The green histogram represents the distribution of void galaxies in the Pan+12 sample (79 947 galaxies) and the cyan histogram represents the distribution of void galaxies in the Voids174 sample (26 864 galaxies).
Current usage metrics show cumulative count of Article Views (full-text article views including HTML views, PDF and ePub downloads, according to the available data) and Abstracts Views on Vision4Press platform.
Data correspond to usage on the plateform after 2015. The current usage metrics is available 48-96 hours after online publication and is updated daily on week days.
Initial download of the metrics may take a while.