Fig. 5.
Download original image
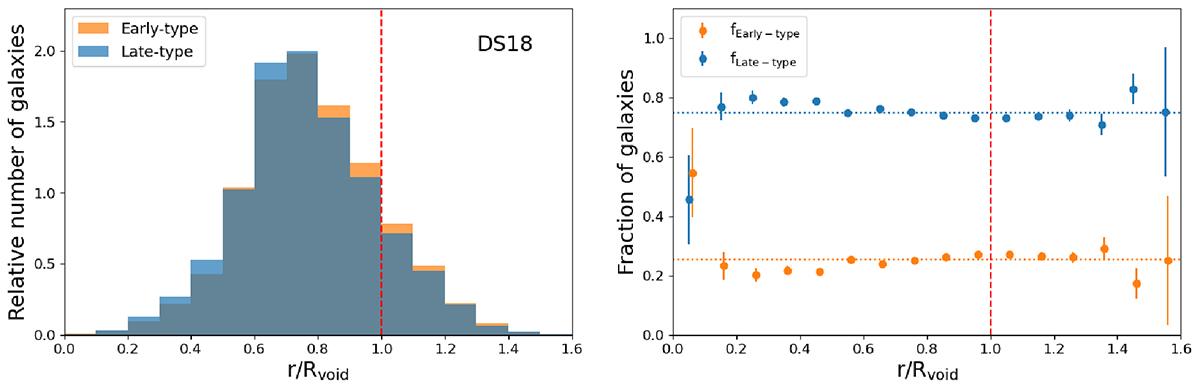
Morphology of void galaxies as a function of void-centric distance. The dashed red vertical line represents the maximum size of the voids if they were spherical. Left: Relative number of early- (6225 galaxies, orange histogram) and late-type (18 839 galaxies, blue histogram) void galaxies. Right: Fraction of early- and late-type galaxies, with their corresponding errors. Early-type galaxies are shown in orange and late-type galaxies in blue. Orange and blue dotted horizontal lines indicate the mean fraction of early- and late-type galaxies, 25.2% and 74.8%, respectively, as presented in Table 1. We use bins of 0.10 r/Rvoid. The fraction of early-type galaxies has been shifted by 0.01 r/Rvoid so that the error bars do not overlap.
Current usage metrics show cumulative count of Article Views (full-text article views including HTML views, PDF and ePub downloads, according to the available data) and Abstracts Views on Vision4Press platform.
Data correspond to usage on the plateform after 2015. The current usage metrics is available 48-96 hours after online publication and is updated daily on week days.
Initial download of the metrics may take a while.