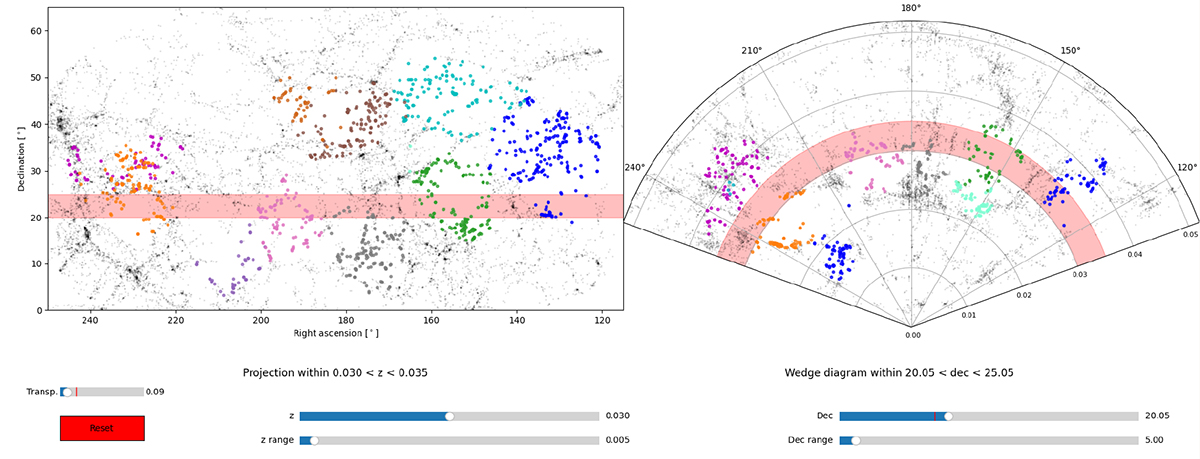
Fig. 1.
Download original image
Spatial distribution of voids in the Voids174 sample using an updated version of the LSSGalPy interactive 3D visualisation tools (Argudo-Fernández et al. 2017, Alcázar-Laynez et al. in prep.) publicly available at https://gitlab.com/astrogal. Only the voids within the redshift range 0.030 ≤ z ≤ 0.035 (left-hand panel) and within 20.05 deg ≤ Dec ≤ 25.05 deg (right-hand panel) are shown. Individual voids are represented in different colours. Galaxies in the large-scale structure in the same redshift and declination (Dec) range are represented by black points. To guide the eye, the red stripe in the left panel shows the selected Dec range in the wedge diagram, and the selected redshift range in the right ascension(RA)–Dec projection corresponding to the right panel.
Current usage metrics show cumulative count of Article Views (full-text article views including HTML views, PDF and ePub downloads, according to the available data) and Abstracts Views on Vision4Press platform.
Data correspond to usage on the plateform after 2015. The current usage metrics is available 48-96 hours after online publication and is updated daily on week days.
Initial download of the metrics may take a while.