Fig. 6.
Download original image
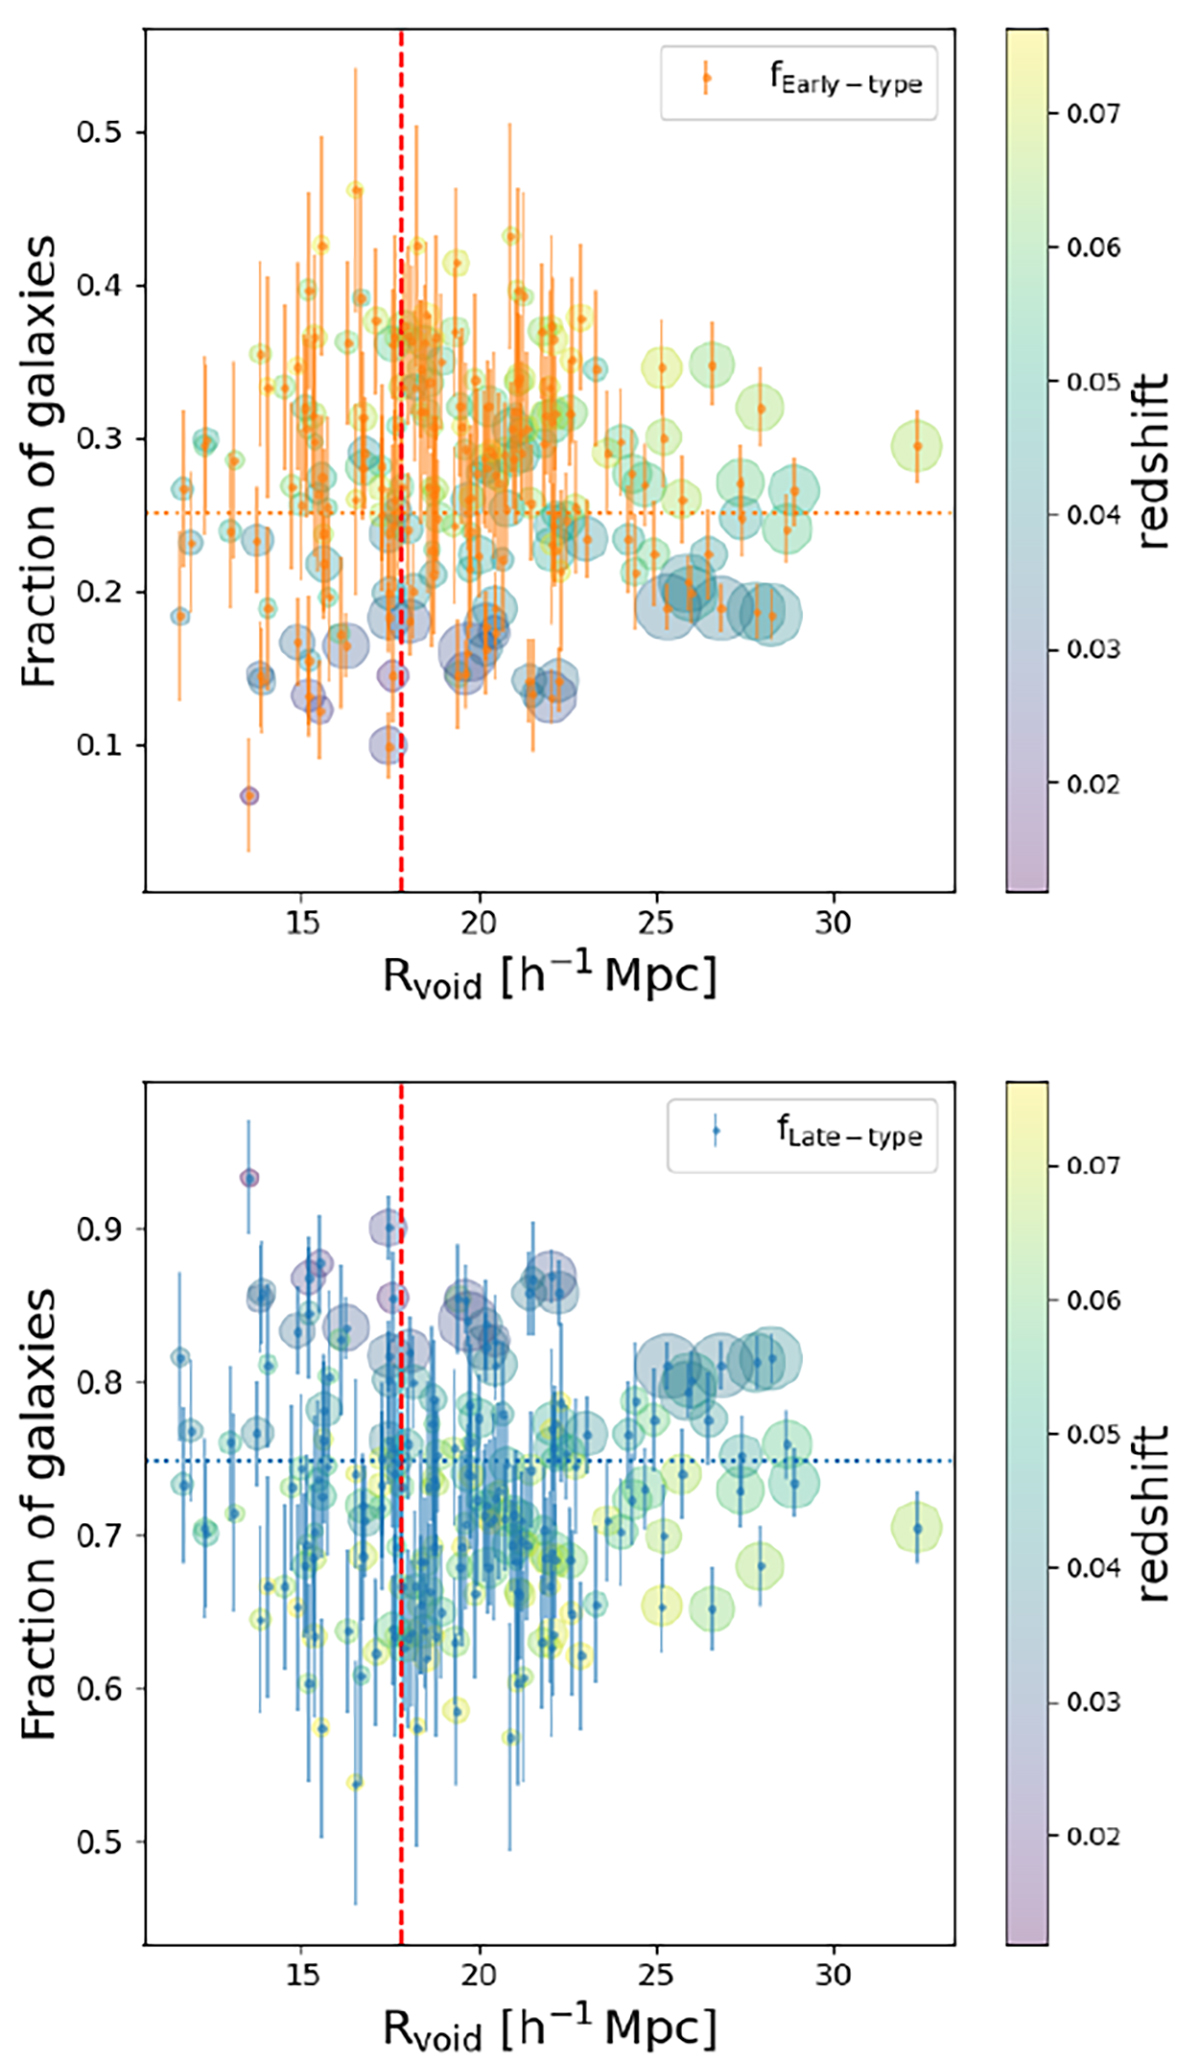
Morphology of void galaxies as a function of void size. Fraction of early-type and late-type galaxies in each void as a function of its size (measured by its effective radius). Each data point corresponds to a single void in the Voids174 sample, in the upper panel for the fraction of early-type galaxies, and in the lower panel for the fraction of late-type galaxies, and thus for the same void fEarly − type + fLate − type = 1. The size of the circle around each data point is proportional to the number of galaxies in the corresponding void, with a minimum of 37 galaxies and a maximum of 622 galaxies. The colour of each circle corresponds to the redshift of the void according to the colour bar to the right side of each panel. The red dashed vertical line represents the median void size of 17.8 h−1 Mpc; meaning that small voids are located on the left-hand side of the plot and large voids on the right-hand side. Orange and blue dotted horizontal lines indicate the mean fraction of early- and late-type galaxies, 25.2% and 74.8% in the Voids174 sample, respectively, as presented in Table 1.
Current usage metrics show cumulative count of Article Views (full-text article views including HTML views, PDF and ePub downloads, according to the available data) and Abstracts Views on Vision4Press platform.
Data correspond to usage on the plateform after 2015. The current usage metrics is available 48-96 hours after online publication and is updated daily on week days.
Initial download of the metrics may take a while.