| Issue |
A&A
Volume 691, November 2024
|
|
|---|---|---|
| Article Number | L6 | |
| Number of page(s) | 5 | |
| Section | Letters to the Editor | |
| DOI | https://doi.org/10.1051/0004-6361/202452023 | |
| Published online | 30 October 2024 | |
Letter to the Editor
No Maunder Minimum phase in HD 4915⋆
1
Instituto de Ciencias Astronómicas, de la Tierra y del Espacio (ICATE), España Sur 1512, CC 49, 5400 San Juan, Argentina
2
Facultad de Ciencias Exactas, Físicas y Naturales, Universidad Nacional de San Juan, San Juan, Argentina
3
Consejo Nacional de Investigaciones Científicas y Técnicas (CONICET), Godoy Cruz 2290, CPC 1425FQB, CABA, Argentina
4
Instituto de Astronomía y Física del Espacio (IAFE), Buenos Aires, Argentina
5
Laboratoire Lagrange, Université Côte d’Azur, Observatoire de la Côte d’Azur, CNRS, Boulevard de l’Observatoire, CS 34229, 06304 Nice Cedex 4, France
6
Departamento de Astronomía, Universidad de La Serena, Avenida Juan Cisternas 1200, La Serena, Chile
7
Universidad de Buenos Aires, Facultad de Ciencias Exactas y Naturales, Departamento de Física, Buenos Aires, Argentina
⋆⋆ Corresponding author; This email address is being protected from spambots. You need JavaScript enabled to view it.
Received:
28
August
2024
Accepted:
8
October
2024
Abstract
Context. The long-term solar magnetic activity and its cyclical behaviour, which is maintained by a dynamo mechanism, are both still challenging problems for astrophysics. In particular, an atypical event occurred between 1645 and 1715, when the solar activity was remarkably decreased and the number of sunspots was extremely reduced. However, the exact events that unfolded during the solar cycle remain unclear. The discovery of longer activity minima in cool stars may shed light on the nature of the complex mechanisms involved in the long-term behaviour of the solar-stellar dynamo.
Aims. Our aim is to explore whether the G5V solar-like star HD 4915, which showed a striking chromospheric activity pattern in a previous study performed with HIRES data, might be considered a bona fide Maunder Minimum (MM) candidate.
Methods. We analysed over 380 spectra acquired between 2003 and 2022 using the HARPS and HIRES spectrographs. We carried out a detailed search for activity signatures in HD 4915 by using the Mount Wilson and the Balmer Hα activity indexes. This task was performed by means of the generalised Lomb-Scargle periodogram.
Results. The new HARPS data show that the chromospheric activity of HD 4915 is not decreasing. In fact, the increases in the activity after the broad minimum in three years reaches the level of activity before this phase, suggesting that it is not entering an MM phase. We also calculate a rotation period of 23.4 ± 0.2 d, which has not been reported before.
Conclusions. HD 4915 shows a distinctive activity behaviour that was initially attributed to a possible and incipient MM phase. Additional HARPS data allowed us to discard an MM in the star. Our analysis shows that the complex activity pattern of HD 4915 might be ruled by a multiple activity cycle, in which a shorter cycle of 4.8 yr is modulated by a potential longer cycle. More activity surveys with extensive records and suitable cadence are crucial for an accurate identification of stars in magnetic grand minima.
Key words: stars: activity / stars: chromospheres / stars: individual: HD 4915
Based on observations made with ESO Telescopes at the La Silla Paranal Observatory under programmes ID 072.C-0488(E), 106.21DB.001, 105.20PH.001, 106.21TJ.001, 108.22CE.001, 109.2392.001 and 110.242T.001.
© The Authors 2024
 Open Access article, published by EDP Sciences, under the terms of the Creative Commons Attribution License (https://creativecommons.org/licenses/by/4.0), which permits unrestricted use, distribution, and reproduction in any medium, provided the original work is properly cited.
This article is published in open access under the Subscribe to Open model. This email address is being protected from spambots. You need JavaScript enabled to view it. to support open access publication.
1. Introduction
Studies of stellar activity were initiated by Olin Wilson at the Mount Wilson Observatory. This pioneering investigation (Wilson 1978) and subsequent works (Vaughan et al. 1978; Noyes et al. 1984; Duncan et al. 1991; Gray & Baliunas 1995; Baliunas et al. 1995) showed that chromospheric variations, similar to those observed in the Sun, are also common in other main-sequence stars. Another important contribution to this field was made by Baliunas et al. (1998). The authors examined over 1000 stars by measuring the Ca II H&K line-core fluxes. As a result, they were able to identify some differences in the long-term activity behaviour: (i) A group of the stars showed a cyclic behaviour with periods between 2.5 and 25 yr and intermediate activity levels. (ii) Some stars displayed an erratic behaviour and were generally associated with stars with high activity levels. (iii) The last group presented flat activity levels corresponding to inactive stars. This group initially drew much attention because these stars are ideal targets for identifying and studying stars in magnetic minima, such as the solar Maunder Minimum (Eddy 1976).
The records of sunspots from 1645 to 1715 revealed a solar surface with very few sunspots. During this period, which is widely known as the Maunder Minimum (hereafter MM), the solar activity was significantly reduced. Some authors suggested that the 11-year cycle was disrupted. In contrast, different works based on counts of sunspots and cosmogenic isotopes indicated a weaker but persistent cycle. Furthermore, in addition to the MM phase, other prolonged intervals of low solar activity, such as the Dalton and Spörer minima (hereafter DM and SM), have been identified, even using other alternative proxies such as auroral and cosmogenic 14C data (see McCracken & Beer 2014; Usoskin et al. 2015; Hayakawa et al. 2021b, for more details). These periods of pronounced changes in the long-term cycling activity are called magnetic grand minima (MGM, Saar & Testa 2012). However, some differences in the magnetic topology seem to be present. For instance, a strong magnetic hemispherical asymmetry was reported during the MM phase, while the DM phase would resemble a modern minimum (Vaquero et al. 2015; Hayakawa et al. 2021a,b).
The search for stars in MGM states is very important for solar and stellar activity studies because they would allow us to improve the current theoretical solar-dynamo models (Charbonneau 2010; Flores et al. 2021). Although for the solar case, the MGM are linked to a special state of the solar dynamo (Usoskin et al. 2015; Hayakawa et al. 2021b), the origin of these unusual periods is currently discussed. In addition, it is unclear whether the solar MGM is a regular or a chaotic process (Usoskin 2017; Biswas et al. 2023). Stars in MGM states are also of considerable interest for studies of space weather and the Earth’s climate (e.g., Owens et al. 2017; Yan et al. 2023).
Although some stars with broad minimum phases in their activity registry are known (e.g., Metcalfe et al. 2013; Ferreira et al. 2020; Baum et al. 2022), only four stars have currently been reported as MM candidates: HD 217014 (Poppenhäger et al. 2009), HD 4915 (Shah et al. 2018), HD 20807 (Flores et al. 2021), and HD 166620 (Luhn et al. 2022). In particular, the time series of the Mount Wilson S-Index (SMW) for HD 4915 showed a clearly decreasing amplitude of its magnetic activity cycle. As a result, Shah et al. (2018) suggested that HD 4915 might be entering an MM state. Additionally, they also noted that the activity behaviour of the star shows a strong similarity when compared with the transition of the Sun into the DM. Based on this evidence, the authors then suggested to continue to observe the object to confirm the nature of this incipient MGM state.
HD 4915 (= HIP 3979, V = 6.9, B−V = 0.67) is a solar-type G5V star. Currently, no planets have been detected around it (Butler et al. 2017). This object was extensively observed under the California Planet Search (CPS) Radial Velocity Survey (Howard et al. 2010) using the Keck I/High Resolution Echelle Spectrometer (HIRES) spectrograph. Fortunately, in the southern hemisphere, the extensive database of the High Accuracy Radial velocity Planet Searcher (HARPS) spectrograph also provides a suitable number of high-resolution spectra, which represents a unique opportunity for confirming or rejecting an MGM state (e.g. an MM or a DM) in HD 4915 by means of two of the most frequently used activity proxies (SMW and Hα). The importance of studying stars close to their MM state strongly encourages us to perform an in-depth analysis of this remarkable object.
This work is organised as follows: In Sect. 2 we describe the observations and data reduction. In Sect. 3 we describe our main results. In Sect. 4 we outline our discussion, and our main conclusions are provided in Sect. 5.
2. Observations and data reduction
The stellar spectra for HD 4915 were obtained from the archive of the European Southern Observatory (ESO)1. These data were acquired with the HARPS spectrograph2, which is installed at the La Silla 3.6 m (ESO) telescope in Chile (Mayor et al. 2003). The resolution of this fibre-fed spectrograph is R ∼ 115 000, and the spectral coverage ranges from 3782 Å to 6913 Å. We collected more than 300 spectra with a resulting signal-to-noise ratio (S/N) of ∼150, measured near 6010 Å. These observations were acquired between 2003 and 2022 under the ID programmes 072.C-0488(E), 106.21DB.001, 105.20PH.001, 106.21TJ.001, 108.22CE.001, 109.2392.001, and 110.242T.001. They were processed with the DRS HARPS pipeline3.
Previous to the calculation of the activity indexes, the spectra were corrected for radial velocities by using the standard IRAF4 routines. Spectra with a low S/N (i.e. ≤100) were discarded. Then, the S-indexes were obtained following the method described in Vaughan et al. (1978). In summary, we first integrated the flux in two windows centred at the cores of the Ca II H&K lines (3968.47 Å and 3933.66 Å, respectively), weighted with triangular profiles of 1.09 Å full width at half maximum (FWHM), and computed the ratio of these fluxes to the mean continuum flux, which was integrated in two passbands with a width of ∼20 Å centred at 3891 and 4001 Å (see Flores et al. 2017, for details). Then, we used the calibration of Lovis et al. (2011) to derive the SMW indexes. On the other hand, the calculation of the Hα indexes for HARPS spectra was performed by using the code ACTIN 25, which was implemented in a Python code by Gomes da Silva et al. (2021).
3. Results
3.1. Long-term activity
In Fig. 1 (upper panel) we show the time series of the SMW indexes derived from HIRES spectra, which were taken from Shah et al. (2018). In this case, HD 4915 displays a significant and striking decrease in the amplitude of the magnetic activity cycle, as pointed out by the authors. Then, in order to identify a possible MGM state in this star, we show in the middle panel the time series of the SMW indexes calculated from HARPS spectra. In addition, the inset corresponds to the Hα indexes that were calculated with ACTIN 2 for the same data. We evaluated the strength of a possible correlation between these indexes by using the Bayesian framework implemented in Python by Figueira et al. (2016). This code allowed us to calculate the posterior probability distribution of the correlation coefficient ρ. As a result, we obtained a very high ρ of 0.912 ± 0.01 with a 95% credible interval between 0.894 and 0.931. Finally, we show in the lower panel the observations corresponding to both surveys, that is, HIRES and HARPS. We also included the monthly average values of the combined indexes. It can be noted that the last HARPS data (i.e. the right shaded region) show a clear increase in the activity of HD 4915 compared to the third maximum (with the lowest amplitude) detected in the HIRES observations.
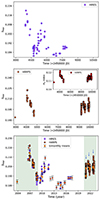 |
Fig. 1. SMW index variation of HD 4915. Upper panel: Time series of the Mt. Wilson index from HIRES observations. Middle panel: Similar to the upper panel, but for HARPS data. This panel also includes the Hα indexes. Lower panel: Time series of the Mt. Wilson index for HD 4915 from combined observations. The HARPS bimonthly means are also indicated with red dots. The two shaded regions represent the time coverage of the new data acquired with HARPS. The blue arrows represent HARPS observations with the highest cadence (see Section 3.2 for details). |
Based on the long-term chromospheric activity pattern shown by the HD 4915 (see Fig. 1), we performed a period analysis for the combined data set. To do this, we applied the Generalised Lomb-Scargle (hereafter GLS) periodogram and also calculated the false-alarm probability (hereafter FAP) of the periods, following Zechmeister & Kürster (2009). These tasks were carried out with a Python code that implements the GLS6. For this calculation, we used the bimonthly averages of all combined data. This procedure, also applied in previous works (e.g., Metcalfe et al. 2010; Flores et al. 2021), allowed us to discard short-timescale variations associated with rotational modulation. As a result, we obtained a period of P1 = (5369 ± 787) d with an FAP of 4.0 × 10−04. Moreover, in order to search for additional short-term yearly variations in the data, we subtracted the main periodic variation of 5369 d and recalculated the corresponding GLS periodogram, according to Suárez Mascareño et al. (2016). For this case, the period and the corresponding FAP are P2 = (1745 ± 114) d and 7.5 × 10−04. As in previous works (Flores et al. 2016; Suárez Mascareño et al. 2016; Flores et al. 2018), we adopted a cut-off in FAP of 0.1 percent (0.001) for a reliable periodicity. The upper and lower panels of Fig. 2 correspond to the resulting GLS periodograms. In Fig. 3 we show the SMW time series and the best fit with a harmonic function of periods P1 and P2, with a Pearson correlation coefficient of 0.65 and a p-value ≤10−4.
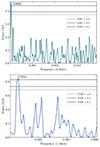 |
Fig. 2. GLS periodogram analysis of the data. Upper panel: GLS periodogram for the combined data (bimonthly averages). Lower panel: GLS periodogram after subtracting the ∼14.7 yr long-term period. Different FAP values are indicated with dashed horizontal lines. |
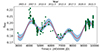 |
Fig. 3. SMW derived from the HIRES and HARPS spectra. The solid line shows the least-square fit with a harmonic function of periods 1745 ± 114 days and 5369 ± 787 days, derived from the GLS periodogram in Fig. 2, with a Pearson correlation coefficient of 0.65 and a p-value ≤10−4. The shaded region represents ±3σ deviations. |
3.2. Rotation
The stellar rotation rate is one of the main dynamic parameters for characterising stellar activity (e.g. Noyes et al. 1984; Böhm-Vitense 2007; Astudillo-Defru et al. 2017). To detect a possible rotational signature in HD 4915, we isolated from Fig. 1 the high-cadence Mount Wilson indexes derived from HARPS spectra (i.e. those corresponding to observations made from 2020 to 2022). In this way, we focused on the last three observing seasons: The first season corresponds to the interval 2020.9–2021.0, the second season corresponds to the interval 2021.4–2021.9, and the last interval corresponds to 2022.6-2022.9 (see the blue arrows in the Fig. 1). Then, we computed the GLS periodogram for each of these seasons, where we detected a significant peak at 22.8 ± 0.44 d, 23.0 ± 0.20 d, and 24.3 ± 0.27 d, respectively. As a result, we obtained a mean short-term period of 23.4 ± 0.2 d. In Fig. 4, we present the observations for the second season, adjusted according to our derived mean period. Although we only show the season with the rotation period closest to the mean and the lowest error (i.e. ±0.20 d), the other two seasons also agree well. Considering the level of activity of HD 4915 (log(R′HK) = − 4.84) and the empirical relations in Noyes et al. (1984) and Mamajek & Hillenbrand (2008), we then estimated a rotation period of ∼23.3 ± 4.30 d and ∼23.2 ± 3.32 d, respectively. As can be noted, our result agrees with the rotational periods derived from calibrations of the chromospheric activity.
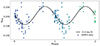 |
Fig. 4. Mount Wilson indexes from the second season highlighted in Fig. 1, phased (shown between 0 and 2) with a period of 23.4 d. The solid black line represents the fitted harmonic curve. |
3.3. Ca II H&K line-core fluxes during minimum phase
Similar to Flores et al. (2021), we explored the components of the Ca II H&K line-core fluxes that cause the low SMW index of HD 4915 in order to disentangle whether the chromospheric heating during the minimum phase is purely acoustic or magnetic. To do this, first we computed the Ca II surface flux from the minimum SMW value using the relations from Mittag et al. (2013) (Eq. 7–10). During the minimum phase, the surface flux reaches FHK = 2.34 × 10⁶ erg s−1 cm−2. Following Martin et al. (2017), where the minimum Ca II flux is composed of the basal and the photospheric contributions, the minimum flux in the Ca II lines is expected to be 1.61 × 10⁶ erg s−1 cm−2 for HD 4915 (B − V = 0.671). Thus, during the minimum phase, the excess flux in the Ca II emission of 7.3 × 10⁵ erg s−1 cm−2 might be attributed to purely magnetic activity.
4. Discussion
It is well known that the Sun has experienced MGM, such as the MM, the DM and the SM (Vecchio et al. 2017; Shah et al. 2018; Carrasco et al. 2021; Silverman & Hayakawa 2021). Similar activity patterns have been also detected in four stars (HD 217014, HD 4915, HD 20807, and HD 166620). In particular, HD 4915 was extensively observed by HIRES between 2006 and 2018. These observations allowed Shah et al. (2018) to detected a minimum activity phase in HD 4915 starting at 2013, based on which, they suggested that the star is possibly entering an MGM. In this work, the authors also emphasized the need to include additional data to confirm or reject the presence of this phenomenon in HD 4915.
Taking the data for HD 4915 available in the HARPS database into account, we extended the Mount Wilson time series of HD 4915 to a time span of 19 years (2003–2022). The Mount Wilson indexes derived from HARPS spectra between 2005 and 2017 presented in Fig. 1 are clearly replicated by line profile variations of Hα (middle panel). They coincide within the statistical errors with the indexes obtained from HIRES spectra reported in Shah et al. (2018), showing a correspondence between the two datasets. Surprisingly, a direct inspection of Fig. 1 (lower panel) shows a clear increase in the amplitude of the magnetic activity for HARPS data after the last activity decrease revealed by the HIRES observations. This fact rules out the possibility that the star HD 4915 is entering an MGM. This new time series confirmed that the broad minimum phase was abandoned near 2016, and in October 2020, the monthly activity level rose to ⟨SMW⟩ = 0.195, which is similar to June 2011 before the minimum phase. This broad minimum phase therefore appeared to last for only three years (2013-2016).
To explore the long-term activity behaviour of HD 4915, we computed the GLS-periodogram for the bimonthly means. Similar to other solar-type stars (Böhm-Vitense 2007; Metcalfe et al. 2013; Oláh et al. 2016; Mittag et al. 2023), HD 4915 seems to present two co-existing activity cycles of ∼14.7 and ∼4.8 years. One way to test the reliability of the two activity periods is to analyse their location in the empirical diagrams of the rotation-activity available in the literature. Based on the rotation period of ∼23 days derived from the short-term modulation in the HARPS index, the shorter activity cycle fits the inactive branch in the diagram of Böhm-Vitense, while the longer cycle is 60% lower than expected for the active branch. However, Boro Saikia et al. (2018) expanded the statistics on cyclic stars and cast doubt on the active branch of the diagram developed by Böhm-Vitense. Recently, Mittag et al. (2023) revisited the empirical relation between the stellar rotation period and the activity cycle lengths. The short activity cycle detected for HD 4915 fit the short period in the power-law Pcyc − Prot relation corrected for colour B − V, where the expected PcycS∼ 1945 days (∼5.3 yr). The coincidence within the statistical error persists even under the colour correction, where the expected value is PcycS ∼ 1668 days. While the calculated long period is PcycL ∼ 9100 days with a dispersion of 40%, the detected long period of (5369 ± 787) days slightly overlaps the calculated range. Although the long period is significant, we therefore recommend that new observations are added to the current time series to obtain a longer time-span and a more accurate value. Nevertheless, our results suggest that the low activity reported between 2013 and 2016 might be associated with the minimum of a longer activity cycle that modulates the short prominent cycle.
In order to explore the level of magnetic contribution during the minimum phase, we computed the surface calcium flux during this lapse. This value exceeds the basal and photospheric flux, which reinforces the fact that a purely magnetic component is responsible for the chromospheric heating in the broad minimum, and although the magnetic activity is depressed, it remains present, resembling the DM phase in the Sun.
5. Conclusions
Shah et al. (2018) reported HD 4915 as one of the four MM solar-type candidates. However, they suggested that further observations of this star are necessary for conclusive results. We therefore included new public observations and performed a long-term analysis of the Mount Wilson index for a 19-year time span. First, we found that the activity level of HD 4915 was rising after the broad minimum reported in Shah et al. (2018). Second, we estimated the calcium fluxes during this particular phase and found that they remarkably exceed the basal level. Then, we computed the GLS periodogram and detected an activity cycle of 4.8 yr that might be modulated by a longer cycle.
All these facts provide evidence that the particular inactive phase detected in HD 4915 might coincide with a minimum of the longer activity cycle, which suppresses the level of activity rather than indicates an MGM phase. Nevertheless, similar to Shah et al. (2018), we strongly suggest to continue observing HD 4915 to confirm the longer cycle.
To date, it is difficult to identify MGM candidates. We have some criteria, such as the relative variation in the SMW index around its mean ( ), the decrease in the amplitude of consecutive cycles, and even the use of binary systems composed of similar stars (Shah et al. 2018; Flores et al. 2021; Luhn et al. 2022). However, the main limitation remains the lack of extended time series. Consequently, more activity surveys with extensive records and suitable cadence are crucial for both the accurate identification of stars in MGM and the improvement of the current theoretical solar-dynamo models, including a better understanding of the magnetic field of the Sun.
IRAF is distributed by the National Optical Astronomical Observatories, which is operated by the Association of Universities for Research in Astronomy, Inc. (AURA), under a cooperative agreement with the National Science Foundation.
Acknowledgments
PM, PC and JA acknowledge the financial support from the Consejo Nacional de Investigaciones Científicas y Técnicas (CONICET) in the form of doctoral fellowships. MJA thanks the financial support of the Dirección de Investigación y Desarrollo de la Universidad de La Serena (DIDULS/ULS, project ID: PAAI2021). CG thanks the financial support of the Secretaría de Ciencia y Técnica in the form of CICITCA fellowships. MFT acknowledges funding from CONICET via Proyectos de Investigación bianual para investigadores asistentes y adjuntos (PIBAA, project ID: 28720210100242CO). AB thanks the Agencia I+D+i and the Universidad de Buenos Aires for their financial support. Finally, we thank the anonymous referee for their constructive comments, which allowed us to greatly improve the quality of the manuscript.
References
- Astudillo-Defru, N., Delfosse, X., Bonfils, X., et al. 2017, A&A, 600, A13 [NASA ADS] [CrossRef] [EDP Sciences] [Google Scholar]
- Baliunas, S. L., Donahue, R. A., Soon, W. H., et al. 1995, ApJ, 438, 269 [Google Scholar]
- Baliunas, S. L., Donahue, R. A., Soon, W., & Henry, G. W. 1998, ASP Conf. Ser., 154, 153 [Google Scholar]
- Baum, A. C., Wright, J. T., Luhn, J. K., & Isaacson, H. 2022, AJ, 163, 183 [NASA ADS] [CrossRef] [Google Scholar]
- Biswas, A., Karak, B. B., Usoskin, I., & Weisshaar, E. 2023, Space Sci. Rev., 219, 19 [NASA ADS] [CrossRef] [Google Scholar]
- Böhm-Vitense, E. 2007, ApJ, 657, 486 [CrossRef] [Google Scholar]
- Boro Saikia, S., Marvin, C. J., Jeffers, S. V., et al. 2018, A&A, 616, A108 [NASA ADS] [CrossRef] [EDP Sciences] [Google Scholar]
- Butler, R. P., Vogt, S. S., Laughlin, G., et al. 2017, AJ, 153, 208 [Google Scholar]
- Carrasco, V. M. S., Hayakawa, H., Kuroyanagi, C., Gallego, M. C., & Vaquero, J. M. 2021, MNRAS, 504, 5199 [NASA ADS] [CrossRef] [Google Scholar]
- Charbonneau, P. 2010, Liv. Rev. Sol. Phys., 7, 3 [Google Scholar]
- Duncan, D. K., Vaughan, A. H., Wilson, O. C., et al. 1991, ApJS, 76, 383 [Google Scholar]
- Eddy, J. A. 1976, Science, 192, 1189 [NASA ADS] [CrossRef] [Google Scholar]
- Ferreira, R. R., Barbosa, R., Castro, M., et al. 2020, A&A, 640, A46 [NASA ADS] [CrossRef] [EDP Sciences] [Google Scholar]
- Figueira, P., Faria, J. P., Adibekyan, V. Z., Oshagh, M., & Santos, N. C. 2016, Origins of Life and Evolution of the Biosphere, 46, 385 [CrossRef] [Google Scholar]
- Flores, M., González, J. F., Jaque Arancibia, M., Buccino, A., & Saffe, C. 2016, A&A, 589, A135 [NASA ADS] [CrossRef] [EDP Sciences] [Google Scholar]
- Flores, M. G., Buccino, A. P., Saffe, C. E., & Mauas, P. J. D. 2017, MNRAS, 464, 4299 [NASA ADS] [CrossRef] [Google Scholar]
- Flores, M., Saffe, C., Buccino, A., et al. 2018, MNRAS, 476, 2751 [NASA ADS] [CrossRef] [Google Scholar]
- Flores, M., Jaque Arancibia, M., Ibañez Bustos, R. V., et al. 2021, A&A, 645, L6 [NASA ADS] [CrossRef] [EDP Sciences] [Google Scholar]
- Gomes da Silva, J., Santos, N. C., Adibekyan, V., et al. 2021, A&A, 646, A77 [NASA ADS] [CrossRef] [EDP Sciences] [Google Scholar]
- Gray, D. F., & Baliunas, S. L. 1995, ApJ, 441, 436 [NASA ADS] [CrossRef] [Google Scholar]
- Hayakawa, H., Iju, T., Uneme, S., et al. 2021a, MNRAS, 506, 650 [CrossRef] [Google Scholar]
- Hayakawa, H., Schlegel, K., Besser, B. P., & Ebihara, Y. 2021b, ApJ, 909, 29 [Google Scholar]
- Howard, A. W., Johnson, J. A., Marcy, G. W., et al. 2010, ApJ, 721, 1467 [Google Scholar]
- Lovis, C., Dumusque, X., Santos, N. C., et al. 2011, ArXiv e-prints [arXiv:1107.5325] [Google Scholar]
- Luhn, J. K., Wright, J. T., Henry, G. W., Saar, S. H., & Baum, A. C. 2022, ApJ, 936, L23 [NASA ADS] [CrossRef] [Google Scholar]
- Mamajek, E. E., & Hillenbrand, L. A. 2008, ApJ, 687, 1264 [Google Scholar]
- Martin, J., Fuhrmeister, B., Mittag, M., et al. 2017, A&A, 605, A113 [NASA ADS] [CrossRef] [EDP Sciences] [Google Scholar]
- Mayor, M., Pepe, F., Queloz, D., et al. 2003, The Messenger, 114, 20 [NASA ADS] [Google Scholar]
- McCracken, K. G., & Beer, J. 2014, J. Geophys. Res. (Space Phys.), 119, 2379 [NASA ADS] [CrossRef] [Google Scholar]
- Metcalfe, T. S., Basu, S., Henry, T. J., et al. 2010, ApJ, 723, L213 [NASA ADS] [CrossRef] [Google Scholar]
- Metcalfe, T. S., Buccino, A. P., Brown, B. P., et al. 2013, ApJ, 763, L26 [Google Scholar]
- Mittag, M., Schmitt, J. H. M. M., & Schröder, K. P. 2013, A&A, 549, A117 [NASA ADS] [CrossRef] [EDP Sciences] [Google Scholar]
- Mittag, M., Schmitt, J. H. M. M., & Schröder, K. P. 2023, A&A, 674, A116 [NASA ADS] [CrossRef] [EDP Sciences] [Google Scholar]
- Noyes, R. W., Hartmann, L. W., Baliunas, S. L., Duncan, D. K., & Vaughan, A. H. 1984, ApJ, 279, 763 [Google Scholar]
- Oláh, K., Kővári, Z., Petrovay, K., et al. 2016, A&A, 590, A133 [NASA ADS] [CrossRef] [EDP Sciences] [Google Scholar]
- Owens, M. J., Lockwood, M., Hawkins, E., et al. 2017, J. Space Weather Space Clim., 7, A33 [NASA ADS] [CrossRef] [EDP Sciences] [Google Scholar]
- Poppenhäger, K., Robrade, J., Schmitt, J. H. M. M., & Hall, J. C. 2009, A&A, 508, 1417 [NASA ADS] [CrossRef] [EDP Sciences] [Google Scholar]
- Saar, S. H., & Testa, P. 2012, IAU Symp., 286, 335 [Google Scholar]
- Shah, S. P., Wright, J. T., Isaacson, H., Howard, A. W., & Curtis, J. L. 2018, ApJ, 863, L26 [NASA ADS] [CrossRef] [Google Scholar]
- Silverman, S. M., & Hayakawa, H. 2021, J. Space Weather Space Clim., 11, 17 [NASA ADS] [CrossRef] [EDP Sciences] [Google Scholar]
- Suárez Mascareño, A., Rebolo, R., & González Hernández, J. I. 2016, A&A, 595, A12 [Google Scholar]
- Usoskin, I. G. 2017, Liv. Rev. Sol. Phys., 14, 3 [Google Scholar]
- Usoskin, I. G., Arlt, R., Asvestari, E., et al. 2015, A&A, 581, A95 [CrossRef] [EDP Sciences] [Google Scholar]
- Vaquero, J. M., Nogales, J. M., & Sánchez-Bajo, F. 2015, Adv. Space Res., 55, 1546 [NASA ADS] [CrossRef] [Google Scholar]
- Vaughan, A. H., Preston, G. W., & Wilson, O. C. 1978, PASP, 90, 267 [Google Scholar]
- Vecchio, A., Lepreti, F., Laurenza, M., Alberti, T., & Carbone, V. 2017, A&A, 599, A58 [CrossRef] [EDP Sciences] [Google Scholar]
- Wilson, O. C. 1978, ApJ, 226, 379 [Google Scholar]
- Yan, L., He, F., Yue, X., et al. 2023, AGU Adv., 4, e2023AV000964 [NASA ADS] [CrossRef] [Google Scholar]
- Zechmeister, M., & Kürster, M. 2009, A&A, 496, 577 [CrossRef] [EDP Sciences] [Google Scholar]
All Figures
|
Fig. 1. SMW index variation of HD 4915. Upper panel: Time series of the Mt. Wilson index from HIRES observations. Middle panel: Similar to the upper panel, but for HARPS data. This panel also includes the Hα indexes. Lower panel: Time series of the Mt. Wilson index for HD 4915 from combined observations. The HARPS bimonthly means are also indicated with red dots. The two shaded regions represent the time coverage of the new data acquired with HARPS. The blue arrows represent HARPS observations with the highest cadence (see Section 3.2 for details). |
| In the text | |
|
Fig. 2. GLS periodogram analysis of the data. Upper panel: GLS periodogram for the combined data (bimonthly averages). Lower panel: GLS periodogram after subtracting the ∼14.7 yr long-term period. Different FAP values are indicated with dashed horizontal lines. |
| In the text | |
|
Fig. 3. SMW derived from the HIRES and HARPS spectra. The solid line shows the least-square fit with a harmonic function of periods 1745 ± 114 days and 5369 ± 787 days, derived from the GLS periodogram in Fig. 2, with a Pearson correlation coefficient of 0.65 and a p-value ≤10−4. The shaded region represents ±3σ deviations. |
| In the text | |
|
Fig. 4. Mount Wilson indexes from the second season highlighted in Fig. 1, phased (shown between 0 and 2) with a period of 23.4 d. The solid black line represents the fitted harmonic curve. |
| In the text | |
Current usage metrics show cumulative count of Article Views (full-text article views including HTML views, PDF and ePub downloads, according to the available data) and Abstracts Views on Vision4Press platform.
Data correspond to usage on the plateform after 2015. The current usage metrics is available 48-96 hours after online publication and is updated daily on week days.
Initial download of the metrics may take a while.