Open Access
Fig. 3.
Download original image
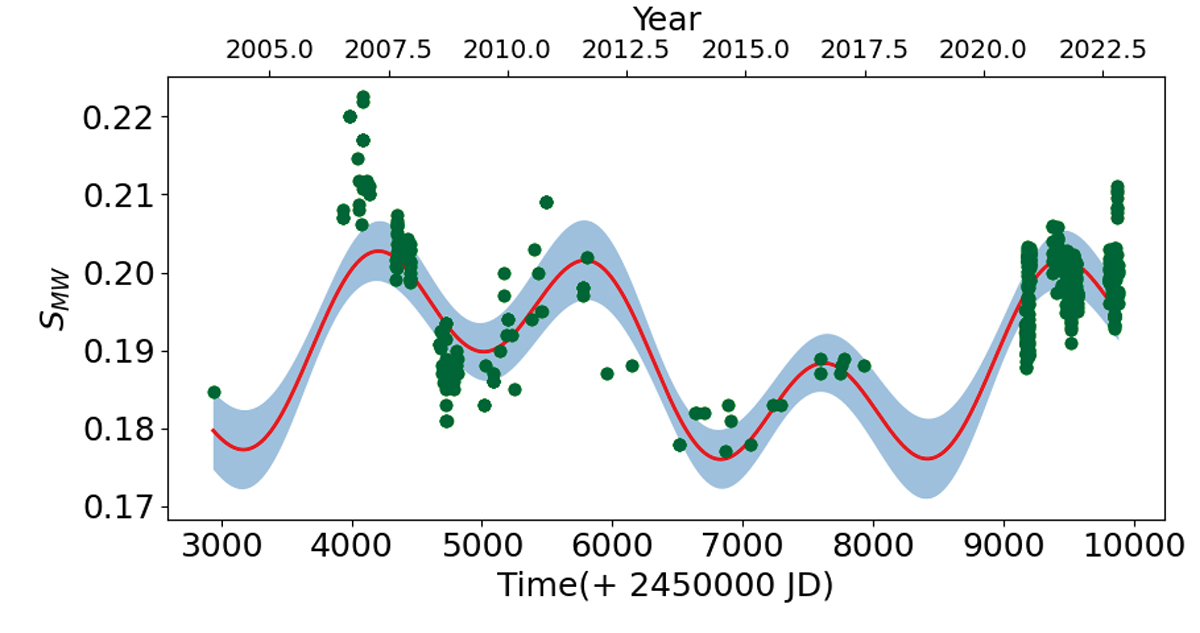
SMW derived from the HIRES and HARPS spectra. The solid line shows the least-square fit with a harmonic function of periods 1745 ± 114 days and 5369 ± 787 days, derived from the GLS periodogram in Fig. 2, with a Pearson correlation coefficient of 0.65 and a p-value ≤10−4. The shaded region represents ±3σ deviations.
Current usage metrics show cumulative count of Article Views (full-text article views including HTML views, PDF and ePub downloads, according to the available data) and Abstracts Views on Vision4Press platform.
Data correspond to usage on the plateform after 2015. The current usage metrics is available 48-96 hours after online publication and is updated daily on week days.
Initial download of the metrics may take a while.