Open Access
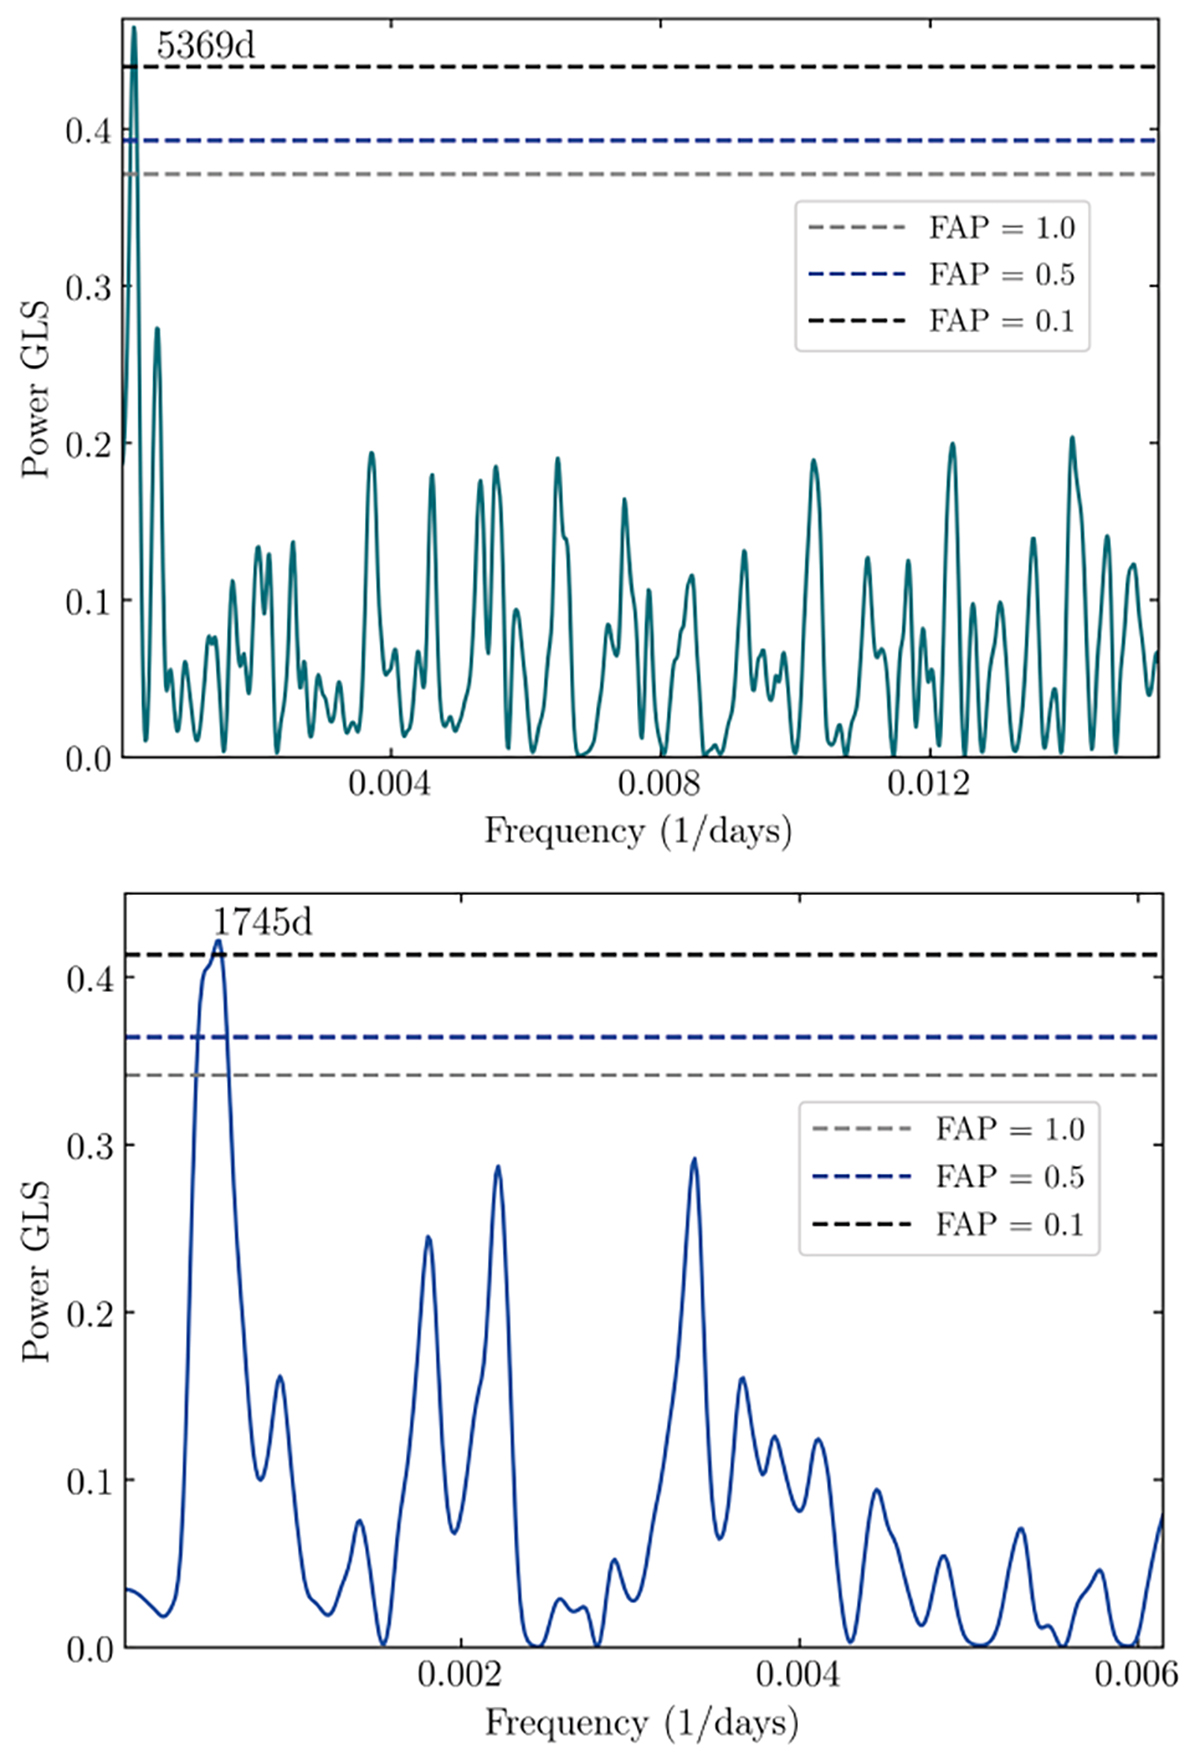
Fig. 2.
Download original image
GLS periodogram analysis of the data. Upper panel: GLS periodogram for the combined data (bimonthly averages). Lower panel: GLS periodogram after subtracting the ∼14.7 yr long-term period. Different FAP values are indicated with dashed horizontal lines.
Current usage metrics show cumulative count of Article Views (full-text article views including HTML views, PDF and ePub downloads, according to the available data) and Abstracts Views on Vision4Press platform.
Data correspond to usage on the plateform after 2015. The current usage metrics is available 48-96 hours after online publication and is updated daily on week days.
Initial download of the metrics may take a while.