| Issue |
A&A
Volume 691, November 2024
|
|
|---|---|---|
| Article Number | A243 | |
| Number of page(s) | 4 | |
| Section | Stellar structure and evolution | |
| DOI | https://doi.org/10.1051/0004-6361/202452021 | |
| Published online | 18 November 2024 | |
Crystallization onset in white dwarfs
Ioffe Institute, Politekhnicheskaya 26, 194021 Saint Petersburg, Russia
⋆ Corresponding author; This email address is being protected from spambots. You need JavaScript enabled to view it.
Received:
27
August
2024
Accepted:
11
October
2024
Abstract
We studied the thermal evolution of the central region of a 0.9 M⊙ C/O white dwarf at the initial stage of ion mixture crystallization by numerically solving the heat equation on a fine spatial and temporal grid and by including a detailed treatment of the latent heat release. The formation of two spherical shells is observed. The outer one surrounds a region where crystallization has begun. The inner one bounds a fully solidified core that has exhausted its latent heat. The region between the shells is partially liquid and partially solid. It gradually emits the latent heat generated by crystallization and also releases light elements (carbon) in the process of element redistribution, which accompanies the mixture solidification. Assuming that all released light elements cross the outer shell, we estimated the flux induced by the mixture crystallization. The resulting flux is not divergent and is much lower than the estimate derived from the growth rate of the fully crystallized core.
Key words: convection / dense matter / plasmas / stars: evolution / stars: interiors / white dwarfs
© The Authors 2024
 Open Access article, published by EDP Sciences, under the terms of the Creative Commons Attribution License (https://creativecommons.org/licenses/by/4.0), which permits unrestricted use, distribution, and reproduction in any medium, provided the original work is properly cited.
This article is published in open access under the Subscribe to Open model. This email address is being protected from spambots. You need JavaScript enabled to view it. to support open access publication.
1. Introduction
The origin of strong magnetic fields in white dwarf (WD) stars is a hot topic of modern astrophysics (e.g., Bagnulo & Landstreet 2022). In particular, the debate as to whether the magnetic field can be generated in the core of a WD via crystallization-driven convection and dynamo is ongoing, and whether it can subsequently emerge and be observed at the stellar surface is a subject of discussion (e.g., Isern et al. 2017; Ginzburg et al. 2022; Fuentes et al. 2023; Montgomery & Dunlap 2024; Blatman & Ginzburg 2024, and references therein). Most recently, Fuentes et al. (2024) have proposed a short-lived (≲10 Myr) phase of efficient composition-driven convection characterized by a high upward light element flux and rapid fluid motions that operates at the initial stage of C/O WD crystallization. Lanza et al. (2024) discuss a powerful dynamo driven by the rapid upward flow of 22Ne-depleted solid flakes in the process of 22Ne distillation prior to core crystallization in C/O/22Ne WDs.
The present paper focuses on crystallizing C/O WDs. We studied the thermal evolution of matter in the inner core region at the freezing onset by numerically solving the heat equation on a fine spatial and temporal grid and by including a detailed treatment of the latent heat release. As a byproduct, we obtain an alternative estimate of the light element flux induced by the C/O mixture crystallization.
2. Model
When the freezing of a WD core begins, the very central region reaches its crystallization temperature and then cannot cool further1 unless all of its latent heat has been released and removed. The release of the latent heat is controlled by the ability of the system to carry it away, that is, by the available thermal gradients and heat fluxes. More outward layers with time also reach their crystallization temperature and start releasing latent heat, that is, the region that has begun crystallization gradually expands. At some point, the central part completely exhausts its latent heat and resumes cooling according to the standard heat equation. This means that, in general, there are three regions when crystallization in a WD begins. In the inner and outer regions, matter cools according to the standard heat equation and is in a crystal and liquid state, respectively. The intermediate region represents a reservoir of heat, where matter is partially solid and partially liquid. Its temperature is equal to the local crystallization temperature2. To model the intermediate region, one simply has to keep track of the balance between the total amount of available heat and the incoming and outgoing heat fluxes.
Since we are mostly interested in a qualitative picture of the freezing onset, our model is significantly simplified. Following Fuentes et al. (2024), we assumed a specific form of the mass density, ρ, dependence on the radial coordinate, r,
 (1)
(1)
where ρc = 1.86 × 10⁷ g/cc is the central density, and RWD = 6371 km is the WD radius. The specific values are taken from the evolutionary model3 of a WD with a thick hydrogen envelope and a mass of MWD = 0.9 M⊙ near the crystallization onset (Bédard et al. 2020, the reference model).
We further assumed equal proportions of C and O by mass but neglected any effects of phase separation and element redistribution, including the gravitational energy release, on the thermal evolution. In reality, the liquid around newly forming crystals becomes depleted of the heavier element (oxygen) and enriched with the lighter element (carbon). This creates composition-driven instability conditions that were discussed by, for example, Fuentes et al. (2023) and Montgomery & Dunlap (2024). They cause the upward light element flux, FX, and an opposite heavy element flux, which replenishes the oxygen content of the liquid. Since we limited our focus to the inner core region and to the initial stages of crystallization, we do not describe these effects in detail, except for estimating the flux FX and assuming a fixed liquid composition. We expect that including these effects, particularly the additional heat that is produced by mixing, which also has to be removed, would only strengthen our conclusions. Furthermore, we neglected any effects associated with the distillation of 22Ne (Isern et al. 1991; Blouin et al. 2021) or any other heavier species.
The crystallization (melting) temperature, Tm, was calculated as
 (2)
(2)
where Z1 = 6 is the carbon charge number, ae = (4πne/3)−1/3, ne is the electron density, Γ1m = 175.6 is the Coulomb coupling parameter of a classic one-component plasma at crystallization (Baiko & Chugunov 2022), and ξCO(3/7)=1.05 is a correction at the value of the oxygen number fraction, xO = 3/7, based on the phase diagram of the C/O mixture (Blouin & Daligault 2021). Furthermore, we assumed: a constant heat capacity of C = 2.7kB per ion, which is a reasonable approximation for mildly quantum liquids and solids (in our system, the ion plasma temperature is ∼3 times greater4 than the actual temperature) in the vicinity of the phase transition (e.g., Baiko & Chugunov 2022); a constant thermal conductivity of κ = 1.2 × 10¹⁶ erg cm−1 s−1 K−1 based on the electron-ion collision frequency calculation, fit, and extrapolation to mixtures (Potekhin et al. 1999); and the latent heat of crystallization for the classic equimass C/O mixture, λ = 0.67 kBTm per ion (Baiko 2023).
A realistic study of the crystallization onset requires a description of the local latent heat release and removal, which in turn requires a non-isothermal approach. In our model, the initial temperature at the stellar center is taken to be 0.03% greater than the melting temperature, Tm(0). The initial temperature profile, Tini(r), is based on the following scaling:
 (3)
(3)
where ⟨A⟩ is the average mass number of the mixture, mu is the atomic mass unit, and dT/dt is a time derivative of the temperature.
We analyzed the thermal evolution of matter only out to r = r0 with r0 = 3000 km to avoid the need to describe the complicated physics of the outer, partially ionized and partially degenerate layers. Consequently, a boundary condition at r0 is required, and for this, we specified the time derivative of the temperature, dT(r0)/dt = α0(t). In principle, the true form of α0(t) can only be obtained from a full-star evolutionary modeling with a high-level code that accounts for the effects investigated in the present paper. In the absence of this, we can first assert that T(r0) decreases monotonously with t, and we can then take advantage of the fact that we are interested in a relatively brief time interval, Δt < 100 Myr since the crystallization onset, which covers the purported efficient convection stage. For this reason, the time derivative was assumed to be constant, α0 = −1.5 × 10⁻¹⁰ K/s. This value of α0 is close to the average time derivative of the central temperature in the reference model shortly before the crystallization onset. On the other hand, in our model this value of α0 results in an average time derivative of the central temperature after the crystallization onset of −0.83 × 10⁻¹⁰ K/s, which is practically the same as the value in the reference model. In addition, we tried several other values of α0 that are within a factor of ∼2 of the above fiducial value. This yielded a qualitatively similar picture of the temperature variation. We therefore do not expect that implementing a weak decrease in |α0(t)| over the considered Δt would affect our main conclusions. We also set dT/dt to α0 in Eq. (3).
3. Results
The result of the modeling is shown in Fig. 1. We display the temperature profile as a function of r, and the different curves correspond to different time stamps. The dotted red curve demonstrates the initial profile. The four solid green curves between it and the long-dashed blue profile show the evolution before the latent heat in the center is exhausted: the upper solid curve is separated by 2 Myr from the initial curve, and the other three curves add 8 Myr of evolution each. On the left side, these solid curves approach the thick short-dashed orange line, which is the profile of the crystallization temperature, and then smoothly merge onto it. At r = 0, they are equal to Tm(0). In this case, there are therefore only two regions: the inner region is at the local crystallization temperature, and the outer region represents the cooling liquid. In the inset, the top left corner of the graph is shown in more detail. The five solid green profiles to the right of the crystallization temperature are separated from each other and from the initial dotted red profile by 400 kyr.
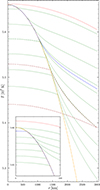 |
Fig. 1. Internal temperature profile of the cooling WD model at various times. We show the initial profile (dotted red), the profile shortly after the formation of the fully crystallized core (long-dashed blue), three profiles at 45.6 Myr since the beginning of the modeling (dot-dashed green for the default latent heat value, dot-dashed brown for twice lower and zero latent heat values), and profiles at other times (solid green; see the main text for details). The crystallization temperature is shown with thick short orange dashes. |
The long-dashed blue curve corresponds to 27.6 Myr since the beginning of the simulation, slightly later than the moment at which the crystallization of the innermost core region is complete, that is, when all its latent heat is removed. Consequently, the solid green curves below it contain three segments that correspond to the three regions described in the first paragraph of Sect. 2. The segments, describing the cooling crystal with progressively lower central temperatures, are seen to the left of the crystallization profile. The mutual time separation between these curves is 8 Myr (the dot-dashed green curve is also part of this family; see below), and the upper curve is at 2 Myr after the long-dashed profile. This regime is characterized by an expansion of the region that has reached Tm(r) and of the region that has exhausted its latent heat and cooled to below Tm(r). The radial extent of the intermediate region shrinks, and by the last curve, which displays the temperature profile at 69.6 Myr, its size becomes smaller than the spatial grid. The five solid green curves to the left of the crystallization temperature profile in the inset are separated from each other and from the long-dashed blue curve by 400 kyr.
For illustration, we show with dot-dashed curves the temperature profile at 45.6 Myr for three sequences with different latent heat values (assuming the same initial profile and boundary condition): the upper green curve corresponds to the standard λ value, and the brown curves in the middle and below demonstrate the cases with λ = 0.33 kBTm and zero latent heat, respectively. For the latter, there should be no difference between the liquid and solid phases in our code. A smooth curve that rapidly cools in the center is in fact obtained.
In Fig. 2 we show the radii of the regions that have started and completed crystallization, denoted as rm and rc, respectively, with dot-dashed red and solid blue curves as functions of time. As in Fig. 1, the difference between the initial time stamps for the two processes is ∼27 Myr. At the beginning, both dependences have an infinite time derivative that qualitatively agrees with the analytic model of Fuentes et al. (2024). Eventually, the two curves merge (to within the spatial grid size).
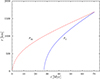 |
Fig. 2. Radius of the region that has started crystallization (dot-dashed red) and of the fully crystallized core (solid blue) vs. time since the beginning of the modeling. |
We next estimated the flux of the light elements, FX, that results from the phase separation that accompanies crystallization (in our case, this is the flux of carbon ions). Fuentes et al. (2024) link the flux with the velocity of the crystallization front. Specifically, if the front moves from r − dr to r over a time interval dt, then the entire spherical shell of thickness dr goes from the liquid to the solid phase in their model. Based on this, the mass of released light elements that then cross a sphere of radius r over the period dt (by convective motions) can be calculated. This quantity was found to be divergent at the initial stages of crystallization.
However, as our solution shows, this picture does not apply at the crystallization onset. The light elements are released rather slowly within the spherical shell with an outer radius rm and an inner radius rc (rc = 0 for the first ∼27 Myr). The mass of released light elements over an interval dt is proportional to the total mass that has solidified. This in turn is proportional to the amount of latent heat that is carried away from this region. When the convection is sufficiently rapid, then the light elements can cross the sphere at rm over the period dt. This provides an upper estimate of the convective flux.
We calculated the flux of light elements using both prescriptions and show the results in Fig. 3. Based on the phase diagram of Blouin & Daligault (2021), we set the difference in the carbon mass fraction between the liquid and the solid to ΔX = 0.11. The dot-dashed blue curve assumes that the flux is determined by the fully crystallized core growth rate. In agreement with the analysis of Fuentes et al. (2024), this curve is divergent. The solid green curve5 takes the gradual release of light elements into account, which is controlled by the latent heat removal that occurred over a period of ∼27 Myr before the start of the fully crystallized core formation. As soon as the central region reaches the crystallization temperature, the flux rapidly grows, starting from zero. Then it is finite everywhere, grows slowly, and is more than twice lower than the previous estimate, even 10 Myr after the appearance of the fully solidified core. At the end of our modeling, rc catches up with rm, and the two calculations of the light element flux coincide, as expected.
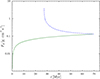 |
Fig. 3. Light element flux vs. time. The dot-dashed blue and solid green curves show fluxes based on the fully crystallized core growth rate and on the gradual release of light elements controlled by the latent heat removal, respectively. |
4. Conclusion
We have modeled the thermal evolution of the internal region of a 0.9 M⊙ C/O WD over a period of ∼70 Myr since the beginning of ion plasma crystallization in its center. We observed the formation of two spherical shells. The outer shell surrounds the region in which crystallization has begun, and the inner shell bounds the fully solidified core, which has exhausted its latent heat. The region between the shells is partially liquid and partially solid. It gradually emits the latent heat generated by the crystallization, which is carried away along the existing thermal gradients, and it also releases light elements in the process of element redistribution that accompanies the mixture solidification. The inner shell first appears ∼27 Myr after the appearance of the outer shell, whose radius reaches ∼1000 km at this moment. At ∼70 Myr, the inner shell catches up with the outer shell, and the crystallization process adopts the familiar motion of a 2D front.
Assuming that all released light elements cross the outer shell, we estimated their flux induced by the mixture crystallization. Until the time when the two shells merge, the result we obtain is significantly lower than the estimate based on the model of Fuentes et al. (2024). In particular, according to Fig. 2 of that work, the efficient convection driven by the light element flux is expected to cease after ∼3 Myr since the formation of the fully solidified core. However, at this moment, the actual flux of the light elements is about five times lower than the Fuentes et al. (2024) prediction and is even lower at earlier times (see Fig. 3). This means that the criterion for efficient convection is not fulfilled at the early stages of WD crystallization, and consequently, such a phenomenon probably does not occur.
This statement is obvious for dense matter composed of a single ion type. For an ionic mixture, it is true when the ion composition of the freezing liquid remains fixed. In what follows, we make this assumption as it is inherent to the effect considered (see below).
This is similar to a water-ice mixture at 0 °C.
The ion plasma temperature Tp ≡ ℏωp/kB ≈ 2.2θD, where ωp is the ion plasma frequency and θD is the Debye temperature. At Tp/T ≫ 1, one-component ion plasma is known to be in the regime of strong ion quantum effects.
To reduce discretization artifacts, we applied a moving average over ±1% of the current time, t.
Acknowledgments
The author is deeply grateful to D. G. Yakovlev for discussions and to expert referee, Mike Montgomery, for valuable comments. This work has been supported by the Russian Science Foundation grant 24-12-00320.
References
- Bagnulo, S., & Landstreet, J. D. 2022, ApJ, 935, L12 [NASA ADS] [CrossRef] [Google Scholar]
- Baiko, D. A. 2023, MNRAS, 522, L26 [NASA ADS] [CrossRef] [Google Scholar]
- Baiko, D. A., & Chugunov, A. I. 2022, MNRAS, 510, 2628 [NASA ADS] [CrossRef] [Google Scholar]
- Bédard, A., Bergeron, P., Brassard, P., & Fontaine, G. 2020, ApJ, 901, 93 [Google Scholar]
- Blatman, D., & Ginzburg, S. 2024, MNRAS, 528, 3153 [NASA ADS] [CrossRef] [Google Scholar]
- Blouin, S., & Daligault, J. 2021, Phys. Rev. E, 103, 043204 [NASA ADS] [CrossRef] [Google Scholar]
- Blouin, S., Daligault, J., & Saumon, D. 2021, ApJ, 911, L5 [NASA ADS] [CrossRef] [Google Scholar]
- Fuentes, J. R., Cumming, A., Castro-Tapia, M., & Anders, E. H. 2023, ApJ, 950, 73 [NASA ADS] [CrossRef] [Google Scholar]
- Fuentes, J. R., Castro-Tapia, M., & Cumming, A. 2024, ApJ, 964, L15 [NASA ADS] [CrossRef] [Google Scholar]
- Ginzburg, S., Fuller, J., Kawka, A., & Caiazzo, I. 2022, MNRAS, 514, 4111 [NASA ADS] [CrossRef] [Google Scholar]
- Isern, J., Mochkovitch, R., García-Berro, E., & Hernanz, M. 1991, A&A, 241, L29 [NASA ADS] [Google Scholar]
- Isern, J., García-Berro, E., Külebi, B., & Lorén-Aguilar, P. 2017, ApJ, 836, L28 [NASA ADS] [CrossRef] [Google Scholar]
- Lanza, A. F., Rui, N. Z., Farihi, J., Landstreet, J. D., & Bagnulo, S. 2024, A&A, 689, A233 [NASA ADS] [CrossRef] [EDP Sciences] [Google Scholar]
- Montgomery, M. H., & Dunlap, B. H. 2024, ApJ, 961, 197 [NASA ADS] [CrossRef] [Google Scholar]
- Potekhin, A. Y., Baiko, D. A., Haensel, P., & Yakovlev, D. G. 1999, A&A, 346, 345 [NASA ADS] [Google Scholar]
All Figures
|
Fig. 1. Internal temperature profile of the cooling WD model at various times. We show the initial profile (dotted red), the profile shortly after the formation of the fully crystallized core (long-dashed blue), three profiles at 45.6 Myr since the beginning of the modeling (dot-dashed green for the default latent heat value, dot-dashed brown for twice lower and zero latent heat values), and profiles at other times (solid green; see the main text for details). The crystallization temperature is shown with thick short orange dashes. |
| In the text | |
|
Fig. 2. Radius of the region that has started crystallization (dot-dashed red) and of the fully crystallized core (solid blue) vs. time since the beginning of the modeling. |
| In the text | |
|
Fig. 3. Light element flux vs. time. The dot-dashed blue and solid green curves show fluxes based on the fully crystallized core growth rate and on the gradual release of light elements controlled by the latent heat removal, respectively. |
| In the text | |
Current usage metrics show cumulative count of Article Views (full-text article views including HTML views, PDF and ePub downloads, according to the available data) and Abstracts Views on Vision4Press platform.
Data correspond to usage on the plateform after 2015. The current usage metrics is available 48-96 hours after online publication and is updated daily on week days.
Initial download of the metrics may take a while.