Open Access
Fig. 3.
Download original image
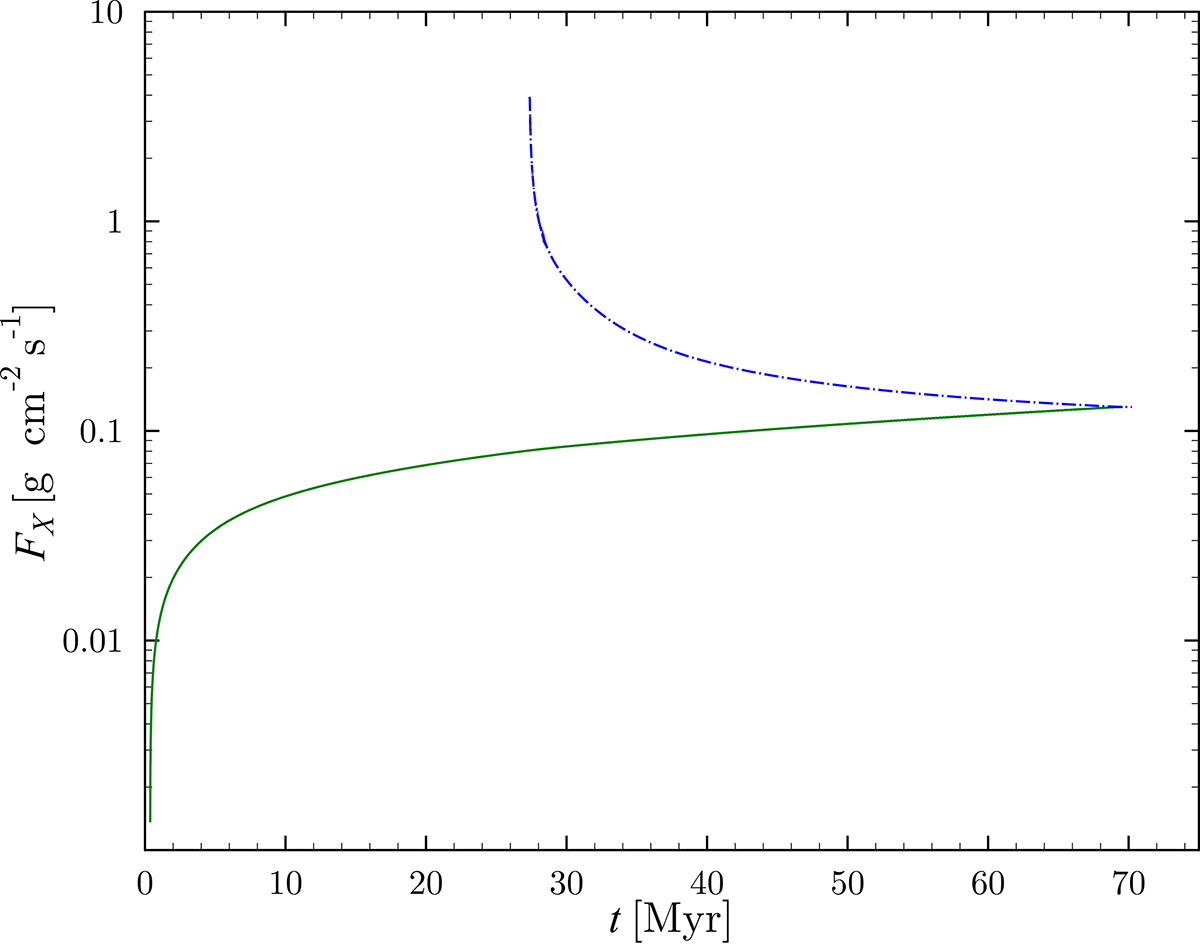
Light element flux vs. time. The dot-dashed blue and solid green curves show fluxes based on the fully crystallized core growth rate and on the gradual release of light elements controlled by the latent heat removal, respectively.
Current usage metrics show cumulative count of Article Views (full-text article views including HTML views, PDF and ePub downloads, according to the available data) and Abstracts Views on Vision4Press platform.
Data correspond to usage on the plateform after 2015. The current usage metrics is available 48-96 hours after online publication and is updated daily on week days.
Initial download of the metrics may take a while.