| Issue |
A&A
Volume 691, November 2024
|
|
|---|---|---|
| Article Number | L13 | |
| Number of page(s) | 6 | |
| Section | Letters to the Editor | |
| DOI | https://doi.org/10.1051/0004-6361/202452002 | |
| Published online | 13 November 2024 | |
Letter to the Editor
A Tale of NGC 3785: The formation of an ultra-diffuse galaxy at the end of the longest tidal tail
1
Indian Institute of Astrophysics, II Block, Koramangala, Bengaluru 560 034, India
2
Pondicherry University, R.V. Nagar, Kalapet, 605014 Puducherry, India
3
SKA Observatory, Jodrell Bank, Lower Withington, Macclesfield, SK11 9FT, UK
4
National Centre for Radio Astrophysics, TIFR, Post Bag 3, Ganeshkhind, Pune 411 007, India
⋆ Corresponding author; chandan@iiap.res.in
Received:
27
August
2024
Accepted:
16
October
2024
Aims. We present the discovery of an extended and faint tail observed in the isolated environment associated with galaxy NGC 3785. This study additionally provides observational evidence supporting the formation of ultra-diffuse galaxies (UDGs) at the end of the tail.
Methods. We utilized the Gnuastro software to detect and analyze the low surface brightness structures in the optical g- and r-bands using data from the Dark Energy Camera Legacy Survey. We created a detection map to identify the faint tail and measured its length using cubic spline fitting. Additionally, we found 84 star-forming clumps along the tail and performed photometric analysis on the tail portion after applying a significance threshold on the signal-to-noise ratio.
Results. We have measured the projected length of the tail, which is ∼390 kpc. We propose that this tail arises from the interaction of the NGC 3785 with a gas-rich galaxy, which ends up as a UDG at the end of the tail.
Key words: galaxies: dwarf / galaxies: evolution / galaxies: formation / galaxies: general / galaxies: interactions / galaxies: structure
© The Authors 2024
 Open Access article, published by EDP Sciences, under the terms of the Creative Commons Attribution License (https://creativecommons.org/licenses/by/4.0), which permits unrestricted use, distribution, and reproduction in any medium, provided the original work is properly cited.
This article is published in open access under the Subscribe to Open model. Subscribe to A&A to support open access publication.
1. Introduction
Galaxy mergers and interactions play an essential role in the evolution of galaxies. These mergers can be classified into subtypes depending on the mass ratio between the less massive and more massive galaxy (Bottrell et al. 2024). For instance, minor mergers have mass ratios of less than 0.25 and are more frequent than major mergers. Whenever galaxies interact, they produce tidal features, which can vary depending on the nature of the merger and the fraction of gas involved in this process. Toomre & Toomre (1972), Barnes (1992) showed in their simulations that tidal bridges and long tails are generated during major mergers, while minor mergers result in tidal streams where the less massive galaxies fall into the more massive ones (Martínez-Delgado et al. 2010).
This fascinating phenomenon occurs when two galaxies collide with each other, resulting in gas and stars being extracted in the form of tidal tails and streams (Watts et al. 2024). Mihos et al. (1998), Springel & White (1999) have shown in their studies that the morphology and length of tidal tails significantly depend on the dark matter halo potential. It has been observed that tidal tails are blue in color, and most of the gas accumulates near the tip of the long tails, which results in the formation of tidal dwarf galaxies (TDGs; Duc et al. 2004) in gas-rich mergers. Wen & Zheng (2016) conducted a study on 461 galaxies with tidal tails in the redshift range of 0.2 < z < 1. They found that these tidal tail galaxies generally originate from star-forming disk galaxies.
In this work, we present the galaxy NGC 3785, which possesses a long extended tail. NGC 3785 has an S0 type morphology (de Vaucouleurs et al. 1991) with redshift ∼0.03 (Albareti et al. 2017), corresponding to a distance of ∼132 Mpc from Earth (Table 1). This galaxy has an extended tail with both straight and curved sections. It has a companion galaxy, SDSS J113939.59+262036.6, with the same redshift. These two galaxies are at a projected distance of ∼103 kpc, and it is unlikely that interactions between these two galaxies are responsible for the tidal tail due to their significant separation.
Properties of the galaxy NGC 3785. These parameters are taken from NED.
The extended tail of NGC 3785 is visible in the Dark Energy Camera Legacy Survey (DECaLS), Sloan Digital Sky Survey (SDSS), and Panoramic Survey Telescope and Rapid Response System (Pan-STARRS) images. However, it is most clearly seen in the DECaLS observation due to the higher sensitivity of that survey. We describe the DECaLS observations in the next section.
We present the discovery of an extended tail and study its properties, such as length and surface brightness. In Section 2, we describe the data we used. In Section 3, we discuss the detection of tail and star-forming clumps associated with the tail. In Section 4, we present the findings obtained from the data and their connection with previous studies. Section 5 summarizes the results. Throughout this Letter, we use the flat ΛCDM model with H0 = 70 km/s/Mpc, Ωm = 0.286, and Ωvac = 0.714, which corresponds to a cosmological scale of 0.602 kpc/′′ at the redshift of NGC 3785.
2. Data
We used g- and r-band images of the DECaLS data release 10 (DR10) described in Dey et al. (2019). DECaLS covers around ∼19 000 deg2 area of the sky at high galactic latitudes, mostly in the north and south galactic cap regions. The Dark Energy Camera (DECam) on the Blanco 4m telescope provides the photometry in the g-, r-, and z-bands, with sensitivity from 400−1000 nm, and reaches an approximate 5σ depth of 23.72, 23.27, and 22.22 AB mag in the g-, r-, and z-bands, respectively, for a fiducial galaxy with an exponential disk profile and a half-light radius of 0.45 arcsec. (Dey et al. 2019). It covers the northern galactic cap and southern galactic cap regions with a declination of ≤32° and 34°, respectively. The DR10 comprises co-added images in the g-, r-, i-, and z-bands with a pixel scale of 0.262′′/pixel.
3. Analysis and results
The extended tail of NGC 3785 was discovered serendipitously by one of the co-authors (OB) in the DECaLS images. A quick look at PanSTARRS and SDSS images of this galaxy shows that the tail is faintly visible in these images, too. This was enough to convince us that the feature was real and not an image artifact. To study the extended and faint tail of NGC 3785, we employed the Gnuastro (GNU Astronomy Utilities) software (Akhlaghi 2018). Gnuastro offers a suite of command-line programs designed for efficient data analysis. Among these programs are astnoisechisel, astscript, astcrop, astfits, asttable, astmkcatalog, astsegment, as well as others, and each serves a specific function, from detecting subtle signals to generating segmentation maps.
The image shown in Figure 1 was prepared using the astscript-color-faint-grey script (Infante-Sainz & Akhlaghi 2024), and it shows the larger field of view (9.1′×9.1′) of NGC 3785 with an extended tail (both the straight and curved regions), and a companion galaxy, SDSS J113939.59+262036.6. The “astscript-color-faint-grey” script takes three input images representing the RGB channel and combines them after applying a series of non-linear transformations. It then normalizes the images in order to create a color-composite image. This offers several parameters, including stretch, colorval, grayval, contrast, and weight, that can be used to customize the RGB image and enhance the faint features. The script uses a default faint gray background to enhance the low surface brightness features. We used the DECaLS DR10 g-, r-, and i-band images to create the RGB image for better visualization of the extended tail.
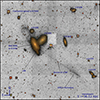 |
Fig. 1. Enhanced tail features of NGC 3785 are shown in a reversed gray scale wherein the background is light gray and the emission is gray. The regions of high S/N are shown in color as a gri composite to highlight the different features. The size of the image is 9.1′×9.1′ (corresponding to a projected field of view of ∼328.7 × 328.7 kpc). In this figure, we have marked other prominent galaxies and their corresponding redshift from the SDSS along with other features, such as a low surface brightness galaxy, which is described in the discussion section. |
We utilized astnoisechisel (Akhlaghi 2019) to uncover faint signals within the dataset. This program employs a quantile thresholding method to identify extremely faint and irregular signals embedded within the noise. Subsequently, we employed astsegment to delineate regions of interest for detailed analysis. astsegment generates a segmentation map highlighting signals surpassing a specified threshold. It furnishes essential parameters, including position (in pixels as well as equatorial coordinates), signal-to-noise ratio, radius (in pixels), magnitude (in nanomaggy), semi-major and semi-minor axes (in pixels), position angle (in degrees), and additional parameters such as surface brightness (in mag/arcsec2).
To effectively detect the tail, we masked the galaxies surrounding NGC 3785 in order to prevent contamination of the light from bright sources. We masked these galaxies with background counts of the field in the g-band image because it has more depth to detect faint features as compared to the other bands. By using a masked image alongside a 0.7 detection growth quantile in the g-band image, we successfully identified the faint tail signal and generated an edge map of these detections as shown in Figure 2. This edge map indicates the boundaries of the tail, and we used it as a guide to refine the tail’s boundaries. Based on visual examination, we marked several points along the tail. Employing the cubic spline fitting technique on these points, we accurately determined the tail’s length by referencing the starting and ending points indicated in the galaxy’s edge map. The measured projected length encompasses the tail’s linear and loop (or curved) segments present in the southwest and northeast of NGC 3785, respectively, totaling approximately 390 kpc, as illustrated in Figure 2. The northeast and southwest segments are part of only one tidal tail, as they follow the same trajectory without any breaks, suggesting that there was only one tidal event. It seems that the satellite galaxy has undergone a tidal interaction with the NGC 3785 starting from the northeast, making a loop, and then going toward the southwest by following the same trajectory. Therefore, this indicates that a single tidal event created the tidal tail, and this path is clearly visible in Figure 1. This observation makes the tail of NGC 3785 the longest tidal tail discovered to date.
 |
Fig. 2. Edge map and trajectory of the tidal tail. Left panel: edge map of the faint tail detection (green contour) on the optical g-band image of the galaxy NGC 3785. The detected edge map helps define the boundary of the endpoints of the tail. Right panel: cubic spline fitting on the data points associated with the straight and looping part of the tail used to measure its length by referencing the edge map. The red arrows show the expected trajectory of the satellite galaxy. |
Once the tail’s borders are defined, the subsequent task involves identifying regions or clumps within the tail region. The purpose of this exercise is to measure the color and surface brightness of these clumps for further analysis. We employed the astsegment task within Gnuastro to identify clumps and generate a segmentation map from the detections produced by the astnoisechisel task. Using these clump detections, we compiled a catalog containing their IDs, right ascension (RA), declination (Dec), magnitude, surface brightness, and S/N. In total, 903 clumps were detected in the entire 9.1′×9.1′ g-band image, encompassing both the tail and other regions. However, our focus is on isolating the clumps within the tail, a process achieved through manual visual inspection, and this resulted in a reduced count of 100 clumps.
Among the 100 clumps detected in the tail, we were left with 84 clumps after applying an S/N threshold of three, as shown in Figure A.1. These 84 clumps are more prominent in the g-band image compared to the r-band image. When we superimposed the g-band detected clumps onto the r-band image, we observed that 48 of them had a detectable r-band emission, while the other 36 do not have any emission in the r-band. These clumps are associated with the faint part of the tail. Although they have a good S/N, their full width at half maximum (FWHM) is smaller than the point spread function (PSF) in the g-band (1.29″), resulting in an unrealistic g − r color. Therefore, we could not use these clumps for photometric analysis, such as the g − r color map. Moreover, Gnuastro provides a surface brightness of these clumps, which covers a range from approximately 23.92 ± 0.45 to 26.55 ± 0.29 mag/arcsec2 in the g-band. These numbers can be compared to those from a recent study by Miro-Carretero et al. (2024), who identified 63 tidal streams in nearby galaxies within 100 Mpc using DECaLS g-, r-, and z-band data. These tidal streams have an average surface brightness range of 24.86 < μg < 28.05 mag/arcsec2 with a 1σ uncertainty. The average projected length of these tidal streams is approximately 50 kpc, which is small compared to the extended tail we detected.
4. Discussion
Our analysis reveals the longest tail ever observed within this isolated environment. It has a projected length of 390 kpc, and the deprojected length could be even larger. It is crucial to note that this tail is not uniformly straight; instead, it comprises both a linear segment and a looping section. Upon visual inspection of Figure 1, two potential scenarios emerged. First, we anticipate that the tail began in the lower-right corner (southwest) of the image, progressing directly toward the galaxy; formed a loop; and concluded just below (northeast) the galaxy. In an alternative scenario, a companion low-mass galaxy appears to orbit around the central high-mass galaxy before proceeding along a linear trajectory toward the southwest, as shown in the right panel of Figure 2. The latter scenario seems more likely for this particular case, an idea we explore further in this section.
While detecting clumps in the tail, we noticed a clump at the southeast end of the tail marked as “LSB” (low surface brightness) in Figure 1. It might be the companion galaxy that interacted with NGC 3785 and ended up as a low surface brightness galaxy, which is feasible according to the first scenario. In order to calculate the stellar mass of this clump, we used the relation given by Du et al. (2020), which provides a relation between the stellar M/L ratio and the optical colors for low surface brightness galaxies. Using this relation, we obtained the stellar mass of the clump as 108.42 M⊙in the g-band with a color g − r = 0.90. This has a surface brightness of 23.843 ± 0.071 mag arcsec−2 in the g-band.
Barnes & Hernquist (1992), Galianni et al. (2010) and Chen et al. (2023) are the studies that also indicate that after an interaction, the tidally stripped galaxy forms small dwarf galaxies that favor the second scenario. The simulations done by Barnes & Hernquist (1992) suggest that dwarf galaxies form within the tidal tails of the galaxies that have undergone interactions. These structures can form in the outer regions of the tidal tail as a result of either the Jeans instabilities within the gas or due to a significant fraction of the stellar material being ejected from the progenitor disk to the tidal tail (Kaviraj et al. 2012). Depending on the surface brightness, these can result in low surface brightness galaxies, ultra-diffuse galaxies (UDGs), or TDGs. UDGs have a very low central surface brightness (μ(g, 0)> 24 mag arcsec−2), but their half-light radius is comparable to typical galaxies.
In Figure 1, one can see that the bottom end of the tail (southwest) has a higher concentration of clumps, and these are also visible in Figure A.1 as well, where most of the clumps are concentrated at the end of the southwest part of the galaxy. If we consider the second scenario and the simulations mentioned above, it might be possible that some structure has started forming at the tip of the tail. We used the two point correlation function (TPCF) to determine if there is actual clustering and to uncover the distribution of these concentrated clumps. TPCF measures the clumpiness of the data points (Peebles 1980) and is calculated as the ratio of the data pairs to the randomly distributed pairs at a given distance in the same bin. As the angular separation between two data points increases, TPCF decreases, resulting in a distortion in the hierarchical distribution (Menon et al. 2021). It implies that higher TPCF values correspond to a higher probability of clustering. For the calculation of angular TPCF in this field, we employed the Landy-Szalay (LS) estimator (Landy & Szalay 1993). We observed that the majority of the clumps with a high TPCF (> 1) are located near the galaxy NGC 3785 and around the tip of its tail (southwest part). High TPCF points toward a clustering of clumps in this region.
To further investigate the nature of these clustered clumps, we took the elliptical aperture around those clumps as shown in Figure A.1 and performed the elliptical aperture photometry using Photutils v1.9.0 (Bradley et al. 2023) to calculate the magnitude and surface brightness in the background subtracted g- and r-band images. From photometric analysis, we found that the g − r color corresponds to a 0.68 ± 0.05 mag with an absolute magnitude (Mg) of −16.55 ± 0.03 mag and a surface brightness of 27.04 ± 0.03 mag arcsec−2. Using the relation between the M/L ratio and the optical colors for low-surface brightness galaxies (Du et al. 2020), the g − r color of the elliptical aperture corresponds to a stellar mass of 108.82 M⊙. This aperture has a very low surface brightness, which satisfies the criteria of UDGs. To determine whether this aperture is associated with the formation of a UDG or low surface brightness galaxy, we replicated Figure 8 from Shi et al. (2017). This figure plots the relationship between g − r color and absolute magnitude, allowing for differentiation between low surface brightness galaxies, UDGs, and typical galaxies. We placed our candidate on the same plot and observed that it is located near the UDGs of Pegasus II (at z = 0.04), as shown in Figure A.2. However, our candidate UDG is located within the red sequence, but it is positioned near the boundary separating the red and blue sequences, and this boundary is typically for normal SDSS galaxies. The UDGs from Shi et al. (2017) are already formed and normally isolated; that is, they do not show any signature of ongoing interactions. In our case, the candidate UDG is still associated with a tidal tail, as the gas-stripping mechanisms, such as tidal stripping, play a crucial role here, causing most of the gas to be stripped away from the satellite galaxy (Bournaud et al. 2004; Hibbard & Mihos 1995; Toomre & Toomre 1972) as it traveled several kiloparsecs to the UDG position. As a result, it lacks sufficient gas, placing it close to a division of a red and blue sequence boundary. It seems that tidal stripping for the candidate UDG is still ongoing, suggesting that it is in the process of becoming a UDG. Due to its diffuse nature and low surface brightness, measuring the effective radius for this UDG is non-trivial. Several studies (e.g., Greco et al. 2017; Bennet et al. 2018; Žemaitis et al. 2023) have highlighted the association of tidal features with UDGs. This supports the idea that tidal interactions play a vital role in the formation and evolution of UDGs.
The clumps detected on the tidal tail are more prominent in the g-band, suggesting that they are blue in color. These clumps are exclusively related to the tail part, as we have discarded any clumps that are part of other bright sources or galaxies while analyzing the tail. Also, NGC 3785 is situated in an isolated environment with no other galaxy present at the same redshift in its field. While S0 galaxies typically have a lower star formation due to their lack of gas, the presence of a long tail associated with this S0 galaxy indicates that it may have undergone interaction with a gas-rich galaxy in the past, leaving behind a trail of star formation.
5. Summary
We have discovered an exceptionally long and faint tail in an isolated environment (likely originating from galaxy interactions) associated particularly with NGC 3785. This tail is seen prominently in the g-band image of the galaxy. Employing an edge map, we measured its length, utilizing the cubic spline fitting method to accommodate its mix of straight and curved segments. Our analysis reveals that the tail has a projected length of approximately 390 kpc, making it the longest tail observed in an isolated environment. It has a length similar to the previously discovered longest tail by Zaritsky et al. (2023), who noted a tail with a projected length of 380 kpc resulting from the tidal interaction between the Kite and the Mrk 0926 galaxies.
We utilized the tail segment identified in our analysis to locate star-forming clumps, and after filtering out unrelated clumps, we were left with 84 clumps in the tail with an S/N above three in the g-band. These 84 clumps revealed that the clumps in the tail region are blue and thus prominent in the g-band, indicative of a possible interaction between NGC 3785 and a gas-rich galaxy, resulting in a trail of stars. Moreover, our examination suggests the imminent emergence of a UDG at the tail’s terminus.
After thoroughly examining the images, we detected a quasar, SDSS J113923.47+261630.5 (z ∼ 1.04), situated behind the galaxy’s tail, marked in Figure 1. From the SDSS spectra for this quasar (Almeida et al. 2023), we investigated if it could assist us in identifying any absorption features caused by the tidal stream. Regrettably, the spectra are quite noisy, posing challenges to distinguishing faint absorption lines from background noise. In the future, deep spectroscopic observations of the quasar and integral field unit observations of the bottom of the tail could help provide more insights into the formation of the UDG at the tip of the tail. Upcoming space- and ground-based deep surveys using the recently launched Euclid Space Telescope and the Legacy Survey of Space and Time soon to commence at the Rubin Observatory will provide more insights into the fascinating world of tidal tails and low surface brightness galaxies.
Acknowledgments
We thank the anonymous referee for the thoughtful review, which improved the impact and clarity of this work. YW acknowledges support from the Department of Atomic Energy, Government of India, under project 12-RD-TFR-5.02-0700. The photometry analysis in this work was partly done using GNU Astronomy Utilities (Gnuastro, ascl.net/1801.009) version 0.22. Work on Gnuastro has been funded by the Japanese MEXT scholarship and its Grant-in-Aid for Scientific Research (21244012, 24253003), the European Research Council (ERC) advanced grant 339659-MUSICOS, and from the Spanish Ministry of Economy and Competitiveness (MINECO) under grant number AYA2016-76219-P. M.A acknowledges the financial support from the Spanish Ministry of Science and Innovation and the European Union – NextGenerationEU through the Recovery and Resilience Facility project ICTS-MRR-2021-03-CEFCA and the grant PID2021-124918NA-C43. The Legacy Surveys consist of three individual and complementary projects: the Dark Energy Camera Legacy Survey (DECaLS; Proposal ID 2014B-0404; PIs: David Schlegel and Arjun Dey), the Beijing-Arizona Sky Survey (BASS; NOAO Prop. ID 2015A-0801; PIs: Zhou Xu and Xiaohui Fan), and the Mayall z-band Legacy Survey (MzLS; Prop. ID 2016A-0453; PI: Arjun Dey). DECaLS, BASS and MzLS together include data obtained, respectively, at the Blanco telescope, Cerro Tololo Inter-American Observatory, NSF’s NOIRLab; the Bok telescope, Steward Observatory, University of Arizona; and the Mayall telescope, Kitt Peak National Observatory, NOIRLab. Pipeline processing and analyses of the data were supported by NOIRLab and the Lawrence Berkeley National Laboratory (LBNL). The Legacy Surveys project is honored to be permitted to conduct astronomical research on Iolkam Du’ag (Kitt Peak), a mountain with particular significance to the Tohono O’odham Nation.
References
- Akhlaghi, M. 2018, Gnuastro: GNU Astronomy Utilities, Astrophysics Source Code Library [record ascl:1801.009] [Google Scholar]
- Akhlaghi, M. 2019, ArXiv e-prints [arXiv:1909.11230] [Google Scholar]
- Albareti, F. D., Allende Prieto, C., Almeida, A., et al. 2017, ApJS, 233, 25 [Google Scholar]
- Almeida, A., Anderson, S. F., Argudo-Fernández, M., et al. 2023, ApJS, 267, 44 [NASA ADS] [CrossRef] [Google Scholar]
- Barnes, J. E. 1992, ApJ, 393, 484 [NASA ADS] [CrossRef] [Google Scholar]
- Barnes, J. E., & Hernquist, L. 1992, Nature, 360, 715 [NASA ADS] [CrossRef] [Google Scholar]
- Bennet, P., Sand, D. J., Zaritsky, D., et al. 2018, ApJ, 866, L11 [NASA ADS] [CrossRef] [Google Scholar]
- Bottrell, C., Yesuf, H. M., Popping, G., et al. 2024, MNRAS, 527, 6506 [Google Scholar]
- Bournaud, F., Duc, P. A., Amram, P., Combes, F., & Gach, J. L. 2004, A&A, 425, 813 [NASA ADS] [CrossRef] [EDP Sciences] [Google Scholar]
- Bradley, L., Sip{\H{o}}cz, B., Robitaille, T., et al. 2023, https://doi.org/10.5281/zenodo.8248020 [Google Scholar]
- Chen, N., LaChance, P., Ni, Y., et al. 2023, ApJ, 954, L2 [CrossRef] [Google Scholar]
- de Vaucouleurs, G., de Vaucouleurs, A., Corwin, Jr., H. G., et al. 1991, Third Reference Catalogue of Bright Galaxies [Google Scholar]
- Dey, A., Schlegel, D. J., Lang, D., et al. 2019, AJ, 157, 168 [Google Scholar]
- Du, W., Cheng, C., Zheng, Z., & Wu, H. 2020, AJ, 159, 138 [CrossRef] [Google Scholar]
- Duc, P. A., Bournaud, F., & Masset, F. 2004, A&A, 427, 803 [NASA ADS] [CrossRef] [EDP Sciences] [Google Scholar]
- Galianni, P., Patat, F., Higdon, J. L., Mieske, S., & Kroupa, P. 2010, A&A, 521, A20 [Google Scholar]
- Greco, J. P., Greene, J. E., Price-Whelan, A. M., et al. 2017, PASJ, 70, S19 [Google Scholar]
- Hibbard, J. E., & Mihos, J. C. 1995, AJ, 110, 140 [Google Scholar]
- Infante-Sainz, R., & Akhlaghi, M. 2024, Res. Notes Am. Astron. Soc., 8, 10 [Google Scholar]
- Kaviraj, S., Darg, D., Lintott, C., Schawinski, K., & Silk, J. 2012, MNRAS, 419, 70 [NASA ADS] [CrossRef] [Google Scholar]
- Landy, S. D., & Szalay, A. S. 1993, ApJ, 412, 64 [Google Scholar]
- Martínez-Delgado, D., Gabany, R. J., Crawford, K., et al. 2010, AJ, 140, 962 [Google Scholar]
- Menon, S. H., Grasha, K., Elmegreen, B. G., et al. 2021, MNRAS, 507, 5542 [CrossRef] [Google Scholar]
- Mihos, J. C., Dubinski, J., & Hernquist, L. 1998, ApJ, 494, 183 [NASA ADS] [CrossRef] [Google Scholar]
- Miro-Carretero, J., Martinez-Delgado, D., Gomez-Flechoso, M.A., et al. 2024, A&A, 691, A196 [NASA ADS] [CrossRef] [EDP Sciences] [Google Scholar]
- Peebles, P. J. E. 1980, The Large-scale Structure of the Universe (Princeton: Princeton University Press) [Google Scholar]
- Shi, D. D., Zheng, X. Z., Zhao, H. B., et al. 2017, ApJ, 846, 26 [Google Scholar]
- Springel, V., & White, S. D. M. 1999, MNRAS, 307, 162 [CrossRef] [Google Scholar]
- Toomre, A., & Toomre, J. 1972, ApJ, 178, 623 [Google Scholar]
- Watts, C., Das, M., & Barway, S. 2024, ApJ, 974, 206 [NASA ADS] [CrossRef] [Google Scholar]
- Wen, Z. Z., & Zheng, X. Z. 2016, ApJ, 832, 90 [NASA ADS] [CrossRef] [Google Scholar]
- Zaritsky, D., Crossett, J. P., Jaffé, Y. L., et al. 2023, MNRAS, 524, 1431 [Google Scholar]
- Žemaitis, R., Ferguson, A. M. N., Okamoto, S., et al. 2023, MNRAS, 518, 2497 [Google Scholar]
Appendix A: Additional Figures
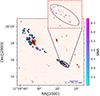 |
Fig. A.1. Clumps detected in the tail. The inset shows the zoomed-in view of the concentrated clumps at the tip of the tail. Each clump is colored by its S/N in the g-band. We took the elliptical aperture around the 18 clumps in order to study their photometric properties such as g − r color, absolute magnitude, and stellar mass. Here, the size of the circle represents the area of the clump in pixels. |
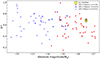 |
Fig. A.2. Recreation of the g − r versus absolute magnitude plot from Shi et al. (2017) to determine whether the faint galaxy at the tip of the tail is a low surface brightness galaxy or a UDG. The data points of low surface brightness galaxies and UDGs in Pegasus I and II are taken from Shi et al. (2017). Our candidate (faint galaxy) is depicted as a yellow square box with error bars, which lies in the region populated by UDGs. |
All Tables
All Figures
|
Fig. 1. Enhanced tail features of NGC 3785 are shown in a reversed gray scale wherein the background is light gray and the emission is gray. The regions of high S/N are shown in color as a gri composite to highlight the different features. The size of the image is 9.1′×9.1′ (corresponding to a projected field of view of ∼328.7 × 328.7 kpc). In this figure, we have marked other prominent galaxies and their corresponding redshift from the SDSS along with other features, such as a low surface brightness galaxy, which is described in the discussion section. |
| In the text | |
|
Fig. 2. Edge map and trajectory of the tidal tail. Left panel: edge map of the faint tail detection (green contour) on the optical g-band image of the galaxy NGC 3785. The detected edge map helps define the boundary of the endpoints of the tail. Right panel: cubic spline fitting on the data points associated with the straight and looping part of the tail used to measure its length by referencing the edge map. The red arrows show the expected trajectory of the satellite galaxy. |
| In the text | |
|
Fig. A.1. Clumps detected in the tail. The inset shows the zoomed-in view of the concentrated clumps at the tip of the tail. Each clump is colored by its S/N in the g-band. We took the elliptical aperture around the 18 clumps in order to study their photometric properties such as g − r color, absolute magnitude, and stellar mass. Here, the size of the circle represents the area of the clump in pixels. |
| In the text | |
|
Fig. A.2. Recreation of the g − r versus absolute magnitude plot from Shi et al. (2017) to determine whether the faint galaxy at the tip of the tail is a low surface brightness galaxy or a UDG. The data points of low surface brightness galaxies and UDGs in Pegasus I and II are taken from Shi et al. (2017). Our candidate (faint galaxy) is depicted as a yellow square box with error bars, which lies in the region populated by UDGs. |
| In the text | |
Current usage metrics show cumulative count of Article Views (full-text article views including HTML views, PDF and ePub downloads, according to the available data) and Abstracts Views on Vision4Press platform.
Data correspond to usage on the plateform after 2015. The current usage metrics is available 48-96 hours after online publication and is updated daily on week days.
Initial download of the metrics may take a while.