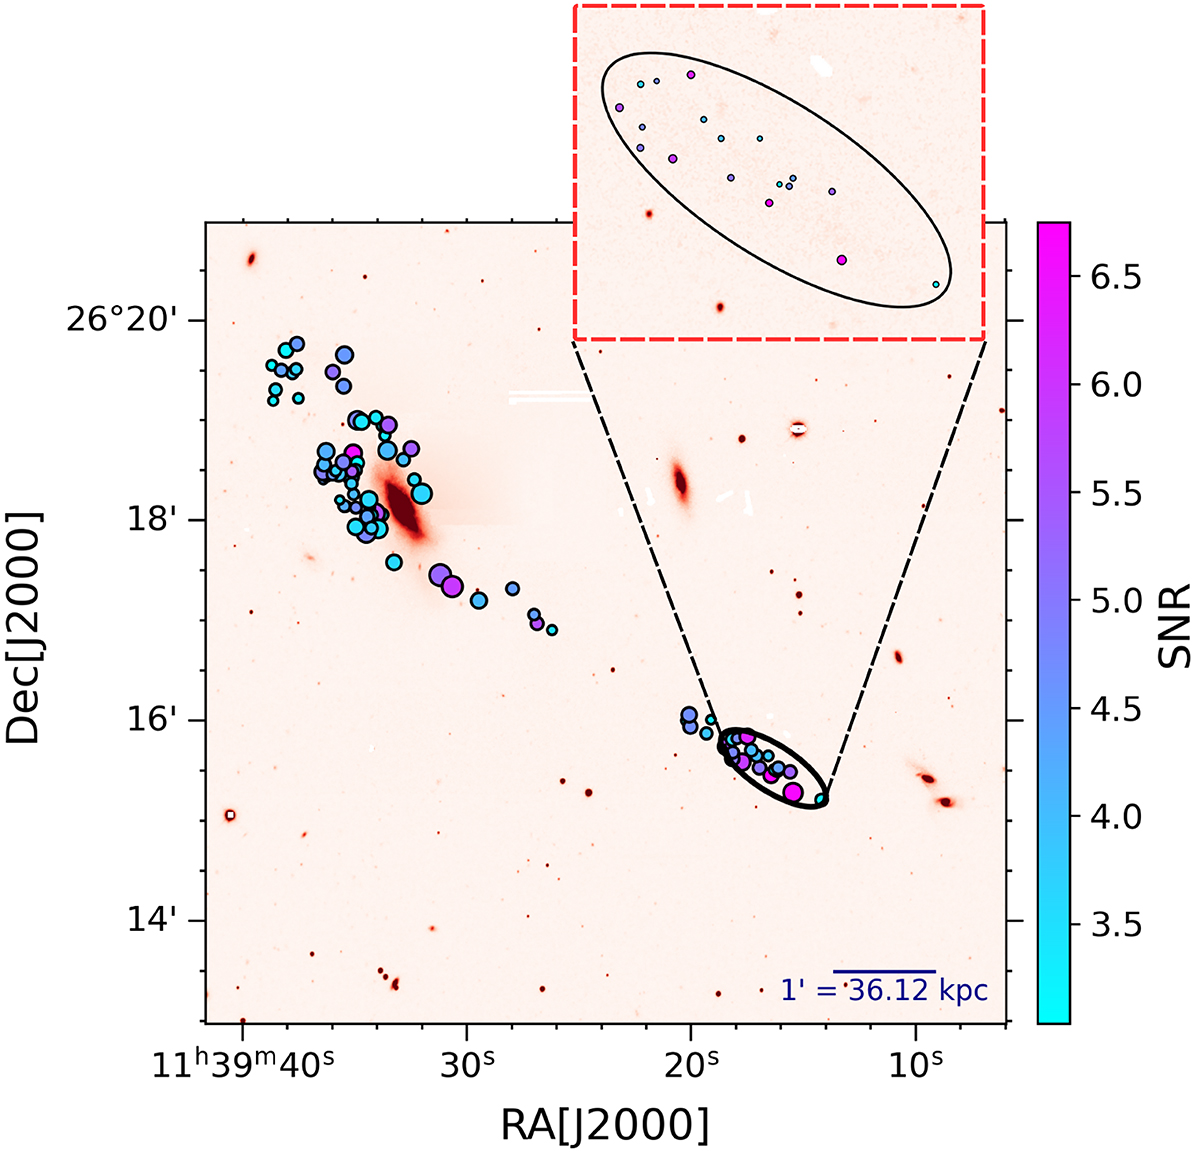
Fig. A.1.
Download original image
Clumps detected in the tail. The inset shows the zoomed-in view of the concentrated clumps at the tip of the tail. Each clump is colored by its S/N in the g-band. We took the elliptical aperture around the 18 clumps in order to study their photometric properties such as g − r color, absolute magnitude, and stellar mass. Here, the size of the circle represents the area of the clump in pixels.
Current usage metrics show cumulative count of Article Views (full-text article views including HTML views, PDF and ePub downloads, according to the available data) and Abstracts Views on Vision4Press platform.
Data correspond to usage on the plateform after 2015. The current usage metrics is available 48-96 hours after online publication and is updated daily on week days.
Initial download of the metrics may take a while.