Fig. 4.
Download original image
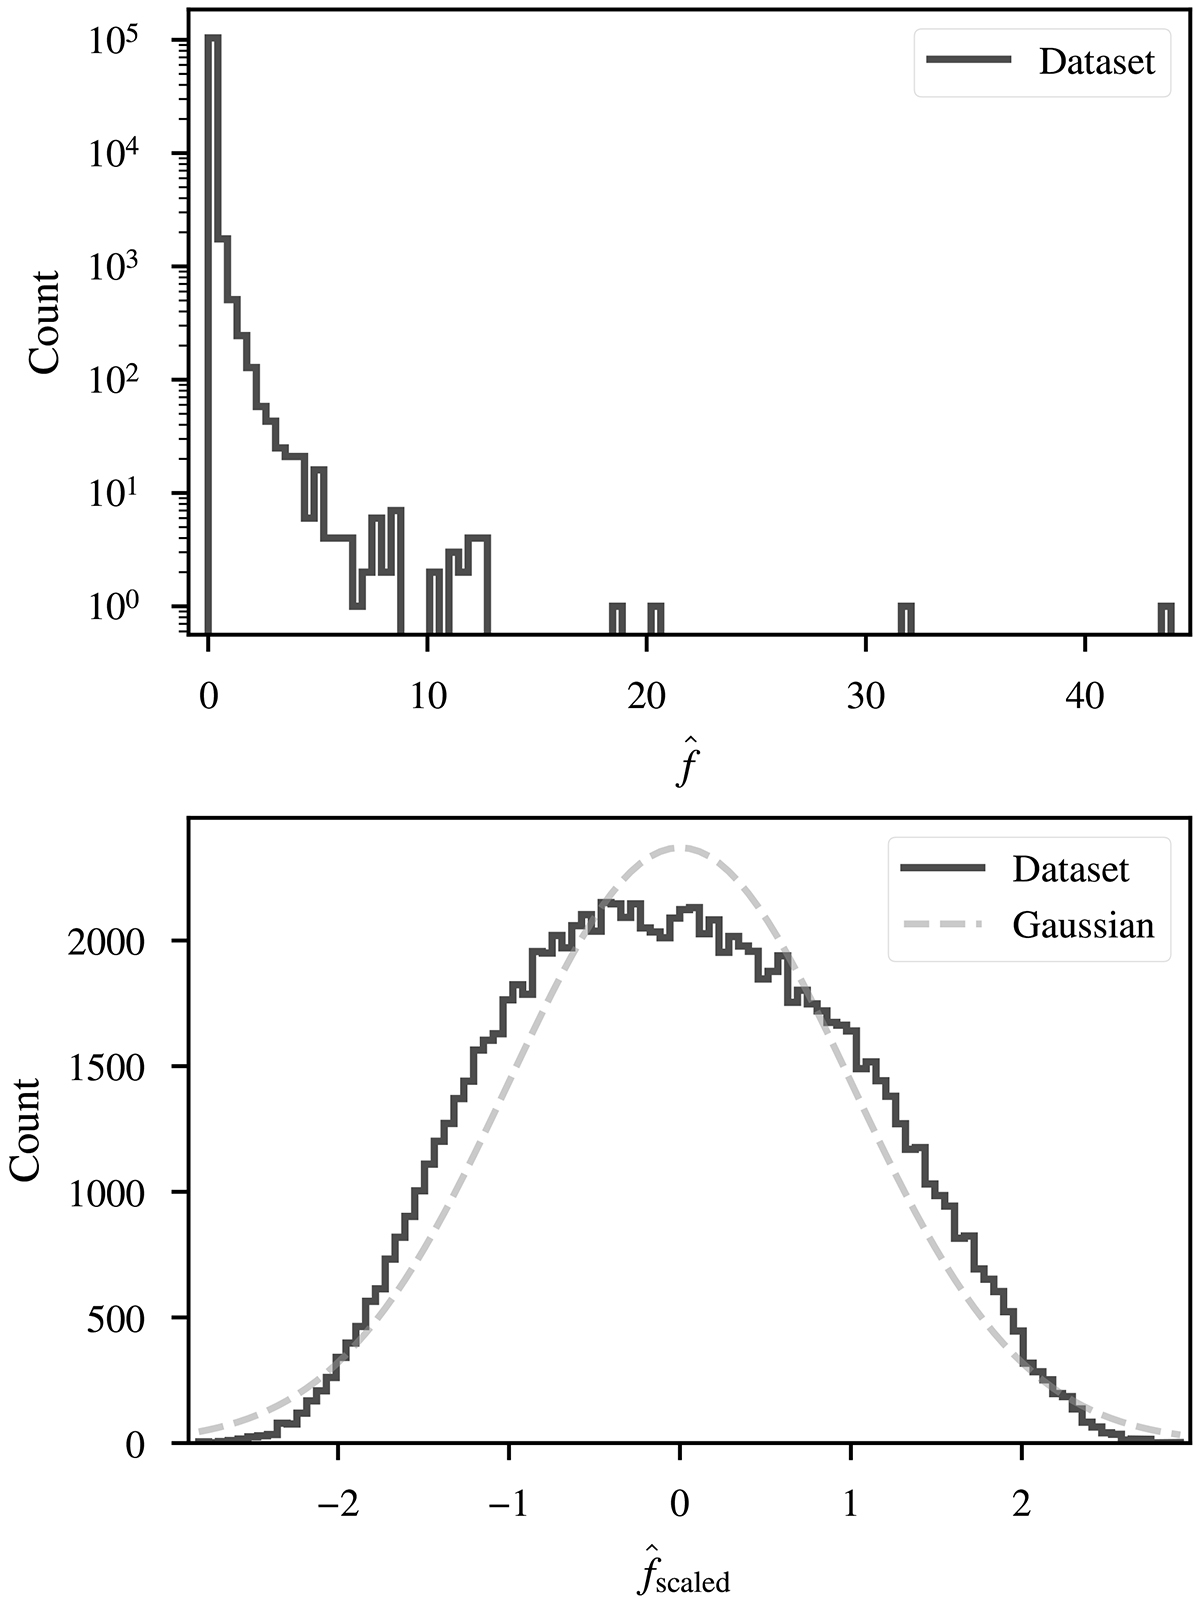
Distributions of maximum flux values ![]() (top) before and
(top) before and ![]() (bottom) after applying the Box-Cox transformation. The distributions comprise the final selection of the LOFAR dataset. For visualization, the bottom figure shows a standard normal distribution with an amplitude scaled to match the data distribution.
(bottom) after applying the Box-Cox transformation. The distributions comprise the final selection of the LOFAR dataset. For visualization, the bottom figure shows a standard normal distribution with an amplitude scaled to match the data distribution.
Current usage metrics show cumulative count of Article Views (full-text article views including HTML views, PDF and ePub downloads, according to the available data) and Abstracts Views on Vision4Press platform.
Data correspond to usage on the plateform after 2015. The current usage metrics is available 48-96 hours after online publication and is updated daily on week days.
Initial download of the metrics may take a while.