| Issue |
A&A
Volume 691, November 2024
|
|
|---|---|---|
| Article Number | A211 | |
| Number of page(s) | 16 | |
| Section | Stellar atmospheres | |
| DOI | https://doi.org/10.1051/0004-6361/202451226 | |
| Published online | 15 November 2024 | |
J-PLUS: The fraction of calcium white dwarfs along the cooling sequence
1
Centro de Estudios de Física del Cosmos de Aragón (CEFCA), Unidad Asociada al CSIC,
Plaza San Juan 1,
44001
Teruel,
Spain
2
Department of Physics, University of Warwick,
Coventry
CV4 7AL,
UK
3
Department of Astronomy,
6th floor, MongManWai Building, Tsinghua University,
Beijing
100084,
PR of China
4
Centro de Estudios de Física del Cosmos de Aragón (CEFCA),
Plaza San Juan 1,
44001
Teruel,
Spain
5
Institut de Ciències del Cosmos (ICCUB), Universitat de Barcelona (UB),
Martí i Franquès 1,
08028
Barcelona,
Spain
6
Departament de Física Quàntica i Astrofísica (FQA), Universitat de Barcelona (UB),
Martí i Franquès 1,
08028
Barcelona,
Spain
7
Institut d’Estudis Espacials de Catalunya (IEEC),
Esteve Terradas, 1, Edifici RDIT, Campus PMT-UPC,
08860
Castelldefels (Barcelona),
Spain
8
Department of Physics, Universita’ degli Studi di Trieste,
Via A. Valerio 2,
34127
Trieste,
Italy
9
Department of Physics and Astronomy, University of Sheffield,
Sheffield
S3 7RH,
UK
10
Centro de Astrobiología (CAB), CSIC-INTA,
Camino Bajo del Castillo s/n,
28692,
Villanueva de la Cañada,
Madrid,
Spain
11
Departament de Física, Universitat Politècnica de Catalunya,
c/Esteve Terrades 5,
08860
Castelldefels,
Spain
12
European Southern Observatory,
Casilla 19001,
Santiago 19,
Chile
13
Donostia International Physics Centre (DIPC),
Paseo Manuel de Lardizabal 4,
20018
Donostia-San Sebastián,
Spain
14
IKERBASQUE, Basque Foundation for Science,
48013
Bilbao,
Spain
15
Observatório Nacional – MCTI (ON),
Rua Gal. José Cristino 77, São Cristóvão,
20921-400
Rio de Janeiro,
Brazil
16
University of Michigan, Department of Astronomy,
1085 South University Ave.,
Ann Arbor,
MI
48109,
USA
17
University of Alabama, Department of Physics and Astronomy,
Gallalee Hall,
Tuscaloosa,
AL
35401,
USA
18
Instituto de Astrofísica de Canarias,
La Laguna,
38205,
Tenerife,
Spain
19
Departamento de Astrofísica, Universidad de La Laguna,
38206,
Tenerife,
Spain
20
Instituto de Astronomia, Geofísica e Ciências Atmosféricas, Universidade de São Paulo,
05508-090
São Paulo,
Brazil
★ Corresponding author; This email address is being protected from spambots. You need JavaScript enabled to view it.
Received:
23
June
2024
Accepted:
21
September
2024
Abstract
Aims. We used the Javalambre Photometric Local Universe Survey (J-PLUS) second data release (DR2) photometry in 12 optical bands over 2176 deg2 to estimate the fraction of white dwarfs with the presence of Ca II H+K absorption along the cooling sequence.
Methods. We compared the J-PLUS photometry against metal-free theoretical models to estimate the equivalent width in the J0395 passband of 10 nm centered at 395 nm (EWJ0395), a proxy to detect calcium absorption. A total of 4399 white dwarfs with effective temperatures within 30 000 > Teff > 5500 K and masses of M > 0.45 M⊙ were analyzed. Their EWJ0395 distribution was modeled using two populations, corresponding to polluted and non-polluted systems, to estimate the fraction of calcium white dwarfs (fCa) as a function of Teff. The probability of each individual white dwarf presenting calcium absorption, pCa, was also computed.
Results. The comparison of EWJ0395 with both the measured Ca/He abundance and the identification of metal pollution from spectroscopy shows that EWJ0395 correlates with the presence of Ca II H+K absorption. The fraction of calcium white dwarfs changes along the cooling sequence, increasing from fCa ≈ 0 at Teff = 13 500 K to fCa ≈ 0.15 at Teff = 5500 K. This trend reflects the selection function of calcium white dwarfs in the optical. We compare our results with the fractions derived from the 40 pc spectroscopic sample and from Sloan Digital Sky Survey (SDSS) spectra. The trend found in J-PLUS observations is also present in the 40 pc sample; however, SDSS shows a deficit of metal-polluted objects at Teff < 12 000 K. Finally, we found 39 white dwarfs with pCa > 0.99. Twenty of them have spectra presented in previous studies, whereas we obtained follow-up spectroscopic observations for six additional targets. These 26 objects were all confirmed as metal-polluted systems.
Conclusions. The J-PLUS optical data provide a robust statistical measurement for the presence of Ca II H+K absorption in white dwarfs. We find a 15 ± 3% increase in the fraction of calcium white dwarfs from Teff = 13 500 K to 5500 K, which reflects their selection function in the optical from the total population of metal-polluted systems.
Key words: methods: statistical / techniques: photometric / white dwarfs
© The Authors 2024
 Open Access article, published by EDP Sciences, under the terms of the Creative Commons Attribution License (https://creativecommons.org/licenses/by/4.0), which permits unrestricted use, distribution, and reproduction in any medium, provided the original work is properly cited.
This article is published in open access under the Subscribe to Open model. This email address is being protected from spambots. You need JavaScript enabled to view it. to support open access publication.
1 Introduction
The presence of metals in the atmosphere of cool white dwarfs is ascribed to the accretion of material from the ancient planetary system (disrupted planets, asteroids, comets) of the degenerate star (e.g., Jura 2003, 2008; Farihi et al. 2010). The presence of metals is indicated by the detection of absorption lines in the white dwarf spectrum. Modeling the metal lines with a careful treatment of diffusion timescales from theory permits one to derive the chemical abundances of the planetary debris (e.g., Koester 2009; Hollands et al. 2017; Turner & Wyatt 2020; Blouin 2020) and the accretion rates (e.g., Koester & Wilken 2006; Hollands et al. 2018a; Blouin & Xu 2022). Thus, the study of metal-polluted white dwarfs provides clues about the formation and evolution of exoplanetary systems.
The fraction of metal-polluted white dwarfs can be as high as 30–50% when the white dwarf population is analyzed with ultraviolet spectroscopy (Koester et al. 2014) or high-resolution (R ≳ 20 000) optical spectroscopy (Zuckerman et al. 2003, 2010; Koester et al. 2005). However, the discovery of these systems has been mainly serendipitous from Sloan Digital Sky Survey (SDSS) medium-resolution (R ~ 2 000) optical spectroscopy (Kleinman et al. 2013; Kepler et al. 2015, 2016, 2019), which is affected by nontrivial selection effects. This hampers the interpretation and representativeness of the measured chemical abundances and accretion rates from the roughly one thousand metal-polluted white dwarfs available in the literature (Coutu et al. 2019).
The main selection bias for metal-polluted systems is the ability to detect absorption lines. The most prominent feature in the optical corresponds to the Ca II H+K line, whose equivalent width (EW) depends on both the effective temperature (Teff) and the atmospheric calcium abundance. This is convolved with the resolution and the signal-to-noise (S/N) of the spectrum, defining a minimum EW for detection which effectively sets an observational limit for Ca in white dwarfs. In addition, the target selection for the spectroscopic observations also impacts the calcium detectability. In this context, white dwarfs with the presence of calcium absorption in the optical, also known as calcium white dwarfs, are a subsample of the complete metal-polluted white dwarf population.
A novel way to analyze the incidence of calcium white dwarfs is using photometric surveys with passbands sensitive to the presence of calcium absorption, such as the Javalambre Photometric Local Universe Survey (J-PLUS, 12 optical filters including the J0395 passband of 100 Å width centered at 3939 Å, Fig. 1; Cenarro et al. 2019), the Southern Photometric Local Universe Survey (S-PLUS, with the same filter system as J-PLUS; Mendes de Oliveira et al. 2019), Pristine (a unique CaHK filter of 98 Å width centered at 3952 Å; Starkenburg et al. 2017), and the Javalambre Physics of the Accelerating Universe Astrophysical Survey (54 contiguous filters of 140 Å in the optical, including two passbands centered at 3900 and 4000 Å; Benítez et al. 2014; Bonoli et al. 2021). The medium-band photometry in these surveys typically has a poorer sensitivity than spectroscopy for the detection of Ca II H+K absorption, but it enables a homogeneous selection over the surveyed area.
In this work, we provide observational constraints on the calcium white dwarf fraction detected in the optical at 30 000 > Teff > 5500 K as a proxy to understand the selection of metal-polluted systems. We used the J-PLUS second data release (DR2; López-Sanjuan et al. 2021) covering 2176 deg2 to supplement the white dwarf catalog presented in Gentile Fusillo et al. (2021, GF21 hereafter), which is based on Gaia EDR3 (Gaia Collaboration 2016, 2021). The J-PLUS photometric results are complemented with the spectroscopic data of the 40 pc sample (O’Brien et al. 2023) and the SDSS DR16 spectra (Ahumada et al. 2020) compiled in the GF21 catalog.
This paper is organized as follows. In Sect. 2, we detail the J-PLUS photometric data and the reference white dwarf catalog used in our analysis. The estimation of the EW in the J0395 filter and the atmospheric parameters of the white dwarfs are presented in Sect. 3. We compare the estimated EWs and effective temperatures derived from photometry with spectroscopic measurements from the literature in Sect. 4. The evolution in the fraction of calcium white dwarfs with the effective temperature by a Bayesian analysis is presented in Sect. 5. The comparison with the spectroscopic samples and the discussion about the selection function in the detection of metal-polluted white dwarfs are detailed in Sect. 6. We devote Sect. 7 to deriving the individual probability of having calcium absorption and present the spectroscopic follow-up of our most probable candidates. Finally, the summary and conclusions are presented in Sect. 8. All magnitudes are expressed in the AB system (Oke & Gunn 1983).
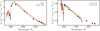 |
Fig. 1 Spectral energy distribution of van Maanen 2 (left panel) and LP 401-31 (right panel), two metal-polluted white dwarfs. The colored symbols in both panels are the 3 arcsec diameter aperture photometry corrected to total flux from J-PLUS: squares for broad bands, u𝑔riz; circles for medium bands of width ranging from 10 nm to 40 nm, J0378, J0395, J0410, J0430, J0515, J0660, and J0861 (see Table A.1 for details). The passband J0395 of 10 nm width is the most sensitive to the presence of Ca II H+K absorption. The brown line shows the spectrum of the source from the Gaia spectro-photometric standard stars survey (Pancino et al. 2012, 2021, left panel) and Limoges et al. (2015, right panel). The unique J-PLUS identification, composed of the TILE_ID of the reference r-band image and the NUMBER assigned by SExtractor to the source, is reported in the panels for reference. |
2 Data
2.1 J-PLUS photometric data
J-PLUS1 is being conducted at the Observatorio Astrofísico de Javalambre (OAJ, Teruel, Spain; Cenarro et al. 2014) using the 83 cm Javalambre Auxiliary Survey Telescope (JAST80) and T80Cam, a panoramic camera of 9.2k × 9.2k pixels. The T80cam camera at JAST80 provides a 2 deg2 field of view (FoV) with a pixel scale of 0.55 arsec pix−1 (Marín-Franch et al. 2015). The J-PLUS photometric system (Table A.1) comprises five SDSS-like (u𝑔riz) and seven medium-band filters centered at key stellar features, such as the 4000 Å break (J0378, J0395, J0410, and J0430), the Mg b triplet (J0515), Hα at rest-frame (J0660), or the calcium triplet (J0861). The most relevant passband in this work is J0395, the third filter in ascending order of central wavelength, which is sensitive to the presence of Ca II H+K absorption, as is illustrated in Fig. 1. The observational strategy, image reduction, and scientific goals of the survey are summarized in Cenarro et al. (2019).
The J-PLUS DR2 comprises 1088 pointings (2176 deg2) observed, reduced, and calibrated in all survey bands (López-Sanjuan et al. 2021). The limiting magnitudes (5σ, 3 arsec aperture) are ~22 mag in the 𝑔 and r passbands, and ~ 21 mag in the other passbands. The median point spread function full width at half maximum (FWHM) in the r band is 1.1 arcsec. Source detection was done in the r-band images using SExtractor (Bertin & Arnouts 1996), and the fluxes measured in the 12 J-PLUS images using the position of the detected sources. Those objects close to bright stars, near to the borders of the images, or affected by artifacts were masked from the initial footprint, providing a high-quality area of 1941 deg2. The DR2 is publicly available on the J-PLUS website2.
We used 3 arcsec diameter aperture photometry to analyze the white dwarf population. The observed fluxes were stored in the vector f = {fj}, and their uncertainties in the vector σf = {σj}, where the index, j, runs over the J-PLUS passbands (Table A.1). The uncertainty vector includes the errors from photon counting, sky background, and photometric calibration (López-Sanjuan et al. 2021). We note that J-PLUS covers the Milky Way halo, so crowding does not affect the quality of the 3 arcsec photometry.
2.2 White dwarf catalog
We based our study on the J-PLUS + Gaia white dwarf catalog defined by López-Sanjuan et al. (2022a). This sample was extracted from the Gaia EDR3 catalog of white dwarfs presented in GF21 and complemented with the J-PLUS DR2 12-band photometry. The sample comprises 5926 white dwarfs with probability PWD > 0.75 in GF21, r ≤ 19.5 mag, and parallax 1 < ϖ < 100 mas. We refer the reader to López-Sanjuan et al. (2022a) for an extended description of the sample, including the Bayesian classification of the sources in H- and He-dominated atmospheres.
2.3 Spectroscopic information
The GF21 catalog also gathers the available spectroscopic information from SDSS DR16 (Ahumada et al. 2020), including an updated spectral classification of the white dwarfs. The main types in the catalog are DA (hydrogen lines), DB (helium lines), DC (featureless continuum), DZ (metal lines), and DQ (carbon lines). We found 1393 sources with S/N > 5 in common with our white dwarfsample, including 59 objects with signs ofmetal pollution.
We also searched for objects in Coutu et al. (2019). The authors perform a detailed abundance analysis of 1023 metal-polluted DZ and DBZ white dwarfs, providing an estimation of their effective temperature and the calcium-over-helium abundance, noted as Ca/He. There are 47 common sources between both datasets.
Finally, we also used the 40 pc sample presented in O’Brien et al. (2024). This volume-limited sample was selected from GF21 candidates and comprises 1076 white dwarfs with both dedicated spectroscopy and ancillary data (Limoges et al. 2015; Tremblay et al. 2020; McCleery et al. 2020; O’Brien et al. 2023). There are 119 metal-polluted white dwarfs in the sample. We refer the reader to the aforementioned papers for an extensive discussion of the 40 pc sample.
3 Estimation of the J0395 equivalent width
We aim to detect the presence of calcium absorption in the sample of 5926 white dwarfs presented in López-Sanjuan et al. (2022a). A possible approach is to analyze the J-PLUS photometry using a set of theoretical models with and without metal-polluted atmospheres. This provides the likelihood for the presence of metals, at the cost of increasing the number of free parameters in the fitting procedure with the abundances of the main polluting elements (i.e., Ca, Mg, and Fe). The relative abundances of these elements can be fixed to those measured in Solar System chondrites (e.g., Lodders 2003), reducing the extra parameters in the analysis to the calcium abundance.
Even in the simplified case, there are two drawbacks: the relative low fraction of metal-polluted systems with strong optical features, ranging from 5% to 15% (Hollands et al. 2018b; McCleery et al. 2020; O’Brien et al. 2023), and the larger sensitivity of the J0395 filter to the presence of calcium absorption with respect the other J-PLUS passbands. In this scenario, half of the white dwarfs would have a larger likelihood of being metal-polluted just because of the random errors in the J0395 photometry of normal, non-polluted systems. In other words, we face a highly degenerate problem.
To solve this statistical challenge, a proper prior is needed in the fraction of calcium white dwarfs as a function of the white dwarf properties; for example, the effective temperature. This is precisely the main goal of the present paper. We circumvented this circular argument by simplifying the analysis as much as possible, defining a proxy for the presence of calcium absorption avoiding theoretical modeling of metal-polluted white dwarfs. The adopted proxy was the EW in the J0395 filter:
![Mathematical equation: $E{W_{J0395}} = 100 \times \left( {1 - {{{f_{J0395}}} \over {f_{J0395}^{{\rm{cont}}}}}} \right)[],$](/articles/aa/full_html/2024/11/aa51226-24/aa51226-24-eq1.png) (1)
(1)
where fJ0395 is the observed flux in the J0395 passband and  is the expected continuum flux in absence of metal pollution. The estimation of the continuum flux is detailed in the next section and the goodness of EWJ0395 as a proxy for the presence of calcium is shown in Sect. 4.
3.1 Estimation of the continuum flux in J0395
The first step to determine the expected continuum flux in the absence of polluting metals for each white dwarf in the sample is the estimation of the following probability density function (PDF),
 (2)
(2)
where θ are the parameters in the fitting, t are the different non-polluted atmospheric compositions considered in our analysis, ℒ is the likelihood of the data for a given set of parameters and composition, and P is the prior probability. The parameters in the fitting were θ = {Teff, log g, ϖ}, corresponding to the effective temperature, surface gravity, and parallax. We explored two atmospheric compositions, corresponding to hydrogen- and helium-dominated atmospheres, t = {H, He}. The final PDF is normalized to one by definition.
We defined the likelihood of the data given a set of parameters and composition as
 (3)
(3)
where the index, j, runs over the J-PLUS passbands (Table A.1) excluding J0395, the function, PG, defines a Gaussian probability distribution,
![Mathematical equation: ${P_{\rm{G}}}(x\mid \mu ,\sigma ) = {1 \over {\sqrt {2\pi } \sigma }}\exp \left[ { - {{{{(x - \mu )}^2}} \over {2{\sigma ^2}}}} \right],$](/articles/aa/full_html/2024/11/aa51226-24/aa51226-24-eq5.png) (4)
(4)
and the model flux was estimated as
 (5)
(5)
where Ft,j is the theoretical absolute flux emitted by a white dwarf of type t located at 10 pc distance, kj is the extinction coefficient of the passband, E(B − V) is the color excess of the white dwarf, and  is the aperture correction needed to translate the observed 3 arcsec diameter magnitudes to total magnitudes. The estimation of the color excess and the aperture correction are detailed in López-Sanjuan et al. (2022a).
The H-dominated atmospheres were described with pure-H models (t = H, Tremblay et al. 2011, 2013), while mixed models with H/He = 10−5 at Teff > 6500 K and pure-He models at Teff < 6500 K were used to describe He-dominated atmospheres (t = He, Cukanovaite et al. 2018, 2019). We assumed the mass-radius relation of Fontaine et al. (2001) for thin (He-atmospheres) and thick (H-atmospheres) hydrogen layers. A discussion of these models is presented elsewhere (e.g., Bergeron et al. 2019; Gentile Fusillo et al. 2020; McCleery et al. 2020).
A Gaussian prior probability for the parallax was used,
 (6)
(6)
where ϖEDR3 and σϖ are the parallax and its error obtained from Gaia EDR3 (Gaia Collaboration 2021; Lindegren et al. 2021b). The published values of the parallax were corrected by the Gaia zero-point offset following the prescription by Lindegren et al. (2021a). Finally, a flat prior for Teff and log g was assumed.
At this stage, we had the PDF of the atmospheric parameters and the composition for each white dwarf. The photometry in the J0395 passband was not used in the fitting process, and the PDF of the expected continuum flux was estimated as
![Mathematical equation: ${\mathop{\rm PDF}\nolimits} \left( {{f_{J0395}}} \right) = \sum\limits_t {\int {{\mathop{\rm PDF}\nolimits} } } (t,\theta ) \times \delta \left[ {{f_{J0395}} - f_{J0395}^{{\rm{mod}}}(t,\theta )} \right]{\rm{d}}\theta ,$](/articles/aa/full_html/2024/11/aa51226-24/aa51226-24-eq9.png) (7)
(7)
where δ is the Dirac delta function and  is the model flux for the 70395 passband following Eq. (5). The final value of
  and its uncertainty were estimated as the median and the dispersion of the best-fit Gaussian to the distribution PDF(fJ0395). We found that this process provides a proper description of the posterior and permits the measurement of the J0395 EW using Eq. (1).
The measurement process is illustrated in Fig. 2 with the J-PLUS source 66690-7017 (WD 1529+428). This white dwarf is classified as DZ (Eisenstein et al. 2006) and presents an intense Ca II H+K absorption, as is highlighted by the SDSS spectrum. The measured EW was EWJ0395 = 41.2 ± 4.2 Å, or a 10 σ detection for the presence of polluting metals using J-PLUS photometry.
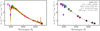 |
Fig. 2 Illustrative example for the estimation of the 70395 EW, EWJ0395, in WD 1529+428, a DZ with spectroscopic information from SDSS (left panel). Symbols are showing the J-PLUS photometry as in Fig. 1. The gray diamonds connected with a solid line in the right panel depict the best-fit solution to J-PLUS photometry but the J0395 passband, with the derived parameters and their uncertainties labeled: effective temperature (Teff), surface gravity (log g) and parallax (ϖ). The white diamond represents the expected continuum flux in the 70395 filter in absence of polluting metals from the fitting process, see Eq. (7). The estimated 70395 EW is also presented in the panel. |
3.2 White dwarf parameters and summary statistics
In addition to EWJ0395, we also estimated the effective temperature and the mass of the analyzed white dwarfs. We marginalized over surface gravity, parallax, and composition to obtain PDF (Teff), and used the mass-weighted version of Eq. (7) to estimate the mass posterior,
![Mathematical equation: ${\mathop{\rm PDF}\nolimits} (M) = \sum\limits_t {\int {{\mathop{\rm PDF}\nolimits} } } (t,\theta ) \times \delta \left[ {M - {M^{{\rm{mod}}}}(t,\theta )} \right]{\rm{d}}\theta .$](/articles/aa/full_html/2024/11/aa51226-24/aa51226-24-eq12.png) (8)
(8)
The retrieved parameters and their uncertainties were again the median and the dispersion of the best-fit Gaussian to the posterior distributions.
The catalog with the parameters used in the present work is publicly available at the J-PLUS database and the Centre de Données astronomiques de Strasbourg (CDS). The description of the catalog is presented in Appendix B.
4 Correlation of EWJ0395 with calcium abundance
In this section, the reliability of EWJ0395 as a proxy for the presence of calcium absorption in white dwarfs is evaluated. We compare the calcium abundance and the temperature from Coutu et al. (2019) with their photometric counterparts in Sects. 4.1 and 4.2. The EWJ0395 of those white dwarfs with metal pollution from the GF21 classification using SDSS DR16 data are presented in Sect. 4.3.
4.1 Ca/He abundance versus effective temperature
We found 47 sources in common between our J-PLUS + Gaia sample and the white dwarfs analyzed by Coutu et al. (2019). They report an EW detection limit of 0.5 Å for their sample, well below the J-PLUS detection limit, providing a proper reference sample to test EWJ0395 as a proxy for the presence of calcium absorption. The calcium abundance, log Ca/He, as a function of Teff from the spectroscopic analysis of Coutu et al. (2019) is presented in Fig. 3. The common white dwarfs cover a wide range of properties, with 5000 < Teff < 15 500 K and −11 < log Ca/Не < −7 dex. Low-abundance systems are only present at cool temperatures due to observational bias: the calcium absorption strengthens at low temperatures, making its detection feasible.
The measured EWJ0395 shows the expected behavior, with larger values for larger calcium abundances at a given effective temperature (Fig. 3, left panel). The typical uncertainty in the measured EWJ0395 of these sources is σEW = 5.9 Å, which translates to a 99% confidence (i.e., S/N > 2.3) in the detection of calcium absorption for systems with EWJ0395 ≳ 13.5 Å. We tested this limit by computing EWJ0395 from the synthetic J-PLUS photometry performed in a set of theoretical models (Koester 2010; Koester et al. 2011) for pure-He atmospheres polluted by metals at different effective temperatures (4000 ≤ Teff ≤ 10000 K in 100 K steps) and calcium abundances (−11 < log Ca/He ≤ −6 dex in 0.2 dex steps). The models had a fixed surface gravity of log g = 8 dex and the abundance of other metals was set to that in the Solar System chondrites (Lodders 2003). Then, we found at each Teff the calcium abundance that produces EWJ0395 = 13.5 Å. The selection limit at temperatures larger than Teff > 10000 K was estimated from the values in Coutu et al. (2019), properly scaled to match the selection limit from our models at the common temperature range, 8000 < Teff < 10000 K. The combined selection curve agrees well with the 99% confidence detection for the data (right panel in Fig. 3). We also found that EWJ0395 departs from the expectations at Teff ≲ 5500 K, where the presence of metals greatly modifies the spectrum even at low abundances and the fitting to the J-PLUS photometry assuming unpolluted atmospheres is not valid anymore. Thus, we set Teff = 5500 K as the lower temperature limit in our study.
We conclude that the measured EWJ0395 provides a proxy for the presence of calcium absorption in metal-polluted white dwarfs, showing the expected trends with Teff and Ca/He.
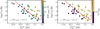 |
Fig. 3 Calcium relative abundance, log Ca/Не, as a function of effective temperature, |

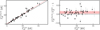 |
Fig. 4 Effective temperature from J-PLUS photometry, |


4.2 Comparison between effective temperatures
We aim to estimate the dependence in the fraction of calcium white dwarfs with the effective temperature. The temperatures from J-PLUS photometry assuming no metal pollution are compared with the values from Coutu et al. (2019), as is presented in Fig. 4. We found an overestimation from J-PLUS of 4%, with no dependence on the effective temperature in the range 5000 < Teff < 15 000 K. This suggests a systematic difference due to our simplified models that assume white dwarfs atmospheres without metals. For consistency, we used the photometric effective temperatures from J-PLUS in the study of the calcium white dwarf population (Sect. 5).
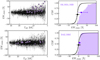 |
Fig. 5 Left panels: EWJ0395 as a function of the effective temperature from J-PLUS photometry (black bullets). The top panels show the 38 white dwarfs with a metal dominant type (DZ, DZA, DZB, etc.) and the bottom panels the 21 white dwarfs with a non-dominant metal type (DAZ, DBZ, etc.) as purple circles. The spectroscopic type is from GF2l for SDSS DR16 spectra with S/N ≥ 5. Right panels: cumulative distribution function (CDF) in EWJo395 for the total sample (black) and the metal-polluted sample (purple). The black and purple circles with error bars depict the median and the [16,84] percentiles of the distribution. |
4.3 EWJ0395 distribution of metal-polluted white dwarfs
In this section, we present the distribution of EWJ0395 for the general white dwarf population and for those systems classified as metal-polluted in the GF2l catalog. Prior to this analysis, we selected white dwarfs with 5500 ≤ Teff ≤ 30 000 K to ensure that EWJo395 is a proper proxy for the calcium absorption (Sect. 4.1) and the uncertainty in the measured effective temperature is below the 5% level (López-Sanjuan et al. 2022a). We also selected objects with M > 0.45 M⊙ to discard low-mass systems from binary evolution and unresolved double degenerates. The final sample comprises 4399 white dwarfs.
The EWJo395 as a function of Teff for the final sample is presented in Fig. 5. The general distribution of the population is well described by a Gaussian with median µ = 0.5 Å and dispersion σ = 8 Å. The 38 white dwarfs dominated by the presence of polluting metals (DZ, DZA, DZB, etc.), following the GF2l classification, are located at Teff < 15 000 K and EWJ0395 > 0 Å. Their distribution is asymmetric, with a median of  and 16% to 84% of the distribution within [7, 53] Å. A two-sized Kolmogorov-Smirnov test yields a probability lower than 10−14 that the general and the metal-dominated populations are drawn from the same parent sample.
The 21 white dwarfs with a subdominant presence of metals (DAZ, DBZ, etc.) in the GF2l classification present lower values of EWJo395 and cover a larger temperature range, reaching Teff ~ 20 000 K. This is the expected trend, with a shallower calcium absorption than the DZ systems. The median and the [l6%,84%] range are  and [1, 10] Å, respectively. In this case, the Kolmogorov-Smirnov test provides a probability of 0.006, or a 2.5σ difference, between the general and the metal-polluted population.
The measured EWJ0395 has the expected behavior with the spectral type, presenting positive values for objects where the optical spectrum is dominated by metal lines and larger values for those classified as DZ. We note that EWJ0395 is statistically positive even for DAZ and DZB hybrid types. Interestingly, Fig. 5 also shows that white dwarfs with significantly positive EWJo395 and without an SDSS spectroscopic counterpart are present in the J-PLUS ± Gaia sample.
As a summary, we found that the EWJ0395 and Teff derived from J-PLUS photometry and Gaia parallaxes are good proxies for the effective temperature and the Ca/Не abundance derived from the spectra. Moreover, the EWJ0395 distribution of the metal-polluted systems presents a positive value and differs from the general population, dominated by non-polluted white dwarfs. The next step in our study was to model the observed EWJ0395 distribution, as is detailed in the next section, to estimate the fraction of white dwarfs with calcium absorption in J-PLUS as a function of Teff.
5 Evolution in the fraction of calcium white dwarfs with the effective temperature
In the previous section, we demonstrated that EWJ0395 is a good proxy to unveil the presence of calcium absorption in white dwarfs. However, the uncertainties in the measurements can blur the difference between genuine metal-polluted systems with EWJ0395 > 0 Å and non-polluted white dwarfs with EWJ0395 = 0 Å. This limitation was solved with a Bayesian modeling of the observed EWJ0395 distribution that includes the effect of the uncertainties and permits one to recover the real, underlying EWJ0395 distribution. The 4399 white dwarfs with 30000 > Teff > 5500 K and M > 0.45 M⊙ were used in the following analysis.
5.1 Modeling of the distribution
The real distribution of EWJ0395 in the absence of observational uncertainties is
 (9)
(9)
where Θ is the set of parameters that define the distribution. The function was normalized to have a unity integral. To simplify the notation, we omit the normalization constants in the following.
The real values of EWJ0395 are blurred during the measuring process due to the observational uncertainties. Thus, the probability of observing an EW for a given set of parameters is
 (10)
(10)
where Gaussian uncertainties were assumed. Combining the individual probabilities for the white dwarf population, the likelihood of the parameters is obtained as
 (11)
(11)
where the index i runs over the white dwarfs in the sample, and EWJ0395 and σEW are the vectors that comprise the individual measurements and their uncertainties, respectively. The posterior probability of the parameters was obtained by applying the priors,
 (12)
(12)
We explored the parameters space with the emcee code (Foreman-Mackey et al. 2013), a Python implementation of the affine-invariant ensemble sampler for the Markov chain Monte Carlo (MCMC) technique proposed by Goodman & Weare (2010). The emcee code provides a collection of solutions, noted as ΘMC, with their density being proportional to the posterior probability of the parameters. We obtained the central values of the parameters and their uncertainties from a Gaussian fit to the distribution of the solutions, noted as  and σΘ, respectively.
To compare the different models, we used the Bayesian information criterion (BIC, Schwarz 1978), defined as
 (13)
(13)
where N is the number of parameters in the model and n the number of white dwarfs in the sample. A BIC difference between models larger than 10 is a strong support for the model with the lower BIC.
Results of the Bayesian fitting to the observed EWJ0395 distribution.
5.2 Temperature-independent models
Models that do not depend on Teff were explored first. This provided us with an initial guess about the relevance of the metal-polluted population. The results for the different models are summarized in Table 1.
The baseline model assumes a unique population of white dwarfs without metal pollution. This is described with a Dirac delta function,
 (14)
(14)
This model has no free parameters and its likelihood was used to normalize all the models in the following. This implies log 𝓛0 = 0 and BIC = 0. We note that the notation was simplified by omitting the dependent variable  and only the parameters of the distribution were explicit.
The next step was to include a second population with positive values of EWJ0395. Our first attempt was to assume a constant density,
 (15)
(15)
where ƒCa is the total fraction of white dwarfs with calcium absorption and H is the Heaviside step function. A prior in ƒCa was applied to restrict its value between zero and one. This model is overwhelmingly favored by the data, with BIC = −3622. The obtained fraction of calcium white dwarfs was ƒCa = 0.016 ± 0.002. We discounted this positive signal being due to systematics in the measurements or in the uncertainties by testing the presence of nonphysical calcium emitters,
 (16)
(16)
We found log 𝓛′1 = 0 and a fraction of calcium emitters that tend to zero. Because the model has one parameter, we obtain BIC = 8 and the baseline model is favored. Hence, we found that the EWJ0395 distribution presents a relevant population of metal-polluted white dwarfs with calcium absorption.
Then, a dependence on EW was included as
 (17)
(17)
where
 (18)
(18)
We found that the data favor a decrease in the number of calcium white dwarfs with EW, α = −0.042 ± 0.007 and ∆BIC = −25 with respect to the model D1. The total fraction of white dwarfs with calcium absorption in this model was ƒCa = 0.035 ± 0.007.
A key aspect of the performed analysis is the accounting for the impact of the observational errors in the broadening of the distributions. We highlight this point by comparing the observed EWJ0395 distribution and the best D2 distribution in Fig. 6. At first glance, both distributions seem to differ significantly. Nevertheless, the model must be convolved with the same observational uncertainties in EWJ0395 for a proper comparison with the observed distribution. Thus, we extracted 5000 random samples of n = 4399 sources from D2, which correspond to  in Eq. (9). Then, we randomly assigned to them the σEW from the observations, and extracted a random value from a Gaussian with median
  and dispersion σEW. Finally, the histograms of the random samples were estimated to obtain the median simulated distribution and its uncertainty. The comparison between the simulated and the observational distributions is excellent (Fig. 6), demonstrating the goodness of the fitting process and the impact of the errors in the underlying, real distribution of EWJ0395.
As a final test, we repeated the procedure above with the baseline model D0; that is, assuming that there are no objects with calcium absorption in the sample. In this case, the negative range is recovered, but the positive range presents a clear excess of objects with large EWs. This visually supports the BIC results summarized in Table 1.
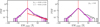 |
Fig. 6 Probability distribution function of the observed EWJo395 (black histogram). The left panel shows the best-fit D2 model and its 68% confidence interval with the red line and area, respectively. The best-fit parameters are labeled in the panel. The purple line and area show the median distribution and its 68% confidence interval obtained from 5000 random samples extracted from D2 and affected by the same uncertainties, σEW, as the observations. The right panel is similar to the left panel but for the baseline model, D0. |
5.3 Temperature-dependent model
The final step in the modeling of the EWJ0395 distribution was to include a dependence on the effective temperature for the fraction of calcium white dwarfs,
![Mathematical equation: $\matrix{ {{D_3}\left( {{T_{{\rm{eff}}}},a,b,\alpha } \right)} \hfill \cr {\quad = \left[ {1 - {F_{{\rm{Ca}}}}\left( {{T_{{\rm{eff}}}},a,b} \right)} \right]{D_0} + {F_{{\rm{Ca}}}}\left( {{T_{{\rm{eff}}}},a,b} \right){D_{{\rm{Ca}}}}(\alpha ),} \hfill \cr } $](/articles/aa/full_html/2024/11/aa51226-24/aa51226-24-eq34.png) (19)
(19)
where
 (20)
(20)
The model D3 has three free parameters, as the effective temperatures of the white dwarfs were measured. We assumed Teff without error in the fitting process.
The main result of the present paper is the change in the fraction of white dwarfs with calcium absorption along the cooling sequence from Eq. (20). We found b = 0.067 ± 0.011 and а = 0.18 ± 0.03, as is presented in Fig. 7. The significance in the slope parameter, α, is at a 6σ level, with a larger fraction of calcium white dwarfs at lower temperatures. The BIC difference with respect to the best temperature-independent model is ∆BIC = −72, implying that the evolution in the fraction of calcium white dwarfs with the effective temperature is largely supported by the data.
We also tried a model with temperature variation in the α parameter. The obtained BIC difference with the model D3 was 3 and there is therefore no evidence for a significant temperature variation in the parameter α. The best-fit value from model D3 was α = −0.047 ± 0.007.
We complemented the result by computing ƒCa at different temperature ranges with model D2 and fixing α = −0.047. The derived fractions are summarized in Table 2 and shown in Fig. 7. The fractions from the individual temperature ranges are compatible with the inference from the global analysis.
The trend in Fig. 7 should be understood as a reflection of the selection effects discussed in Sects. 1 and 4. Assuming a total fraction of metal-polluted white dwarfs of 30%–50% (Zuckerman et al. 2003, 2010; Koester et al. 2014) without any effective temperature dependence, the change in the EW detection limit with Teff (Fig. 3) naturally creates the observed trend.
We stress that the ƒCa obtained from the modeling of the EWJ0395 distribution is not equivalent to the fraction of white dwarfs above a given EW, but proportional due to the functional form assumed to describe the population of white dwarfs with calcium absorption in Eq. (18).
The key point of our result is that the observed ƒCa encodes the selection function of calcium white dwarfs in the optical from the total population of metal-polluted systems. Hence, the comparison of the J-PLUS results with the fraction of calcium white dwarfs obtained from spectroscopic samples permits one to better understand the impact of the target selection in the spectroscopic case, as is explored in the following section.
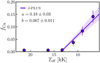 |
Fig. 7 Fraction of white dwarfs with calcium absorption (ƒCa) as a function of the effective temperature (Teff). The best-fit FCa model and its 68% confidence interval are shown with the purple line and area, respectively. The parameters of the linear trend from Eq. (20) are presented in the panel. The purple dots depict the fractions obtained with the temperature-independent model D2 at different Teff intervals. |
Fraction of calcium white dwarfs measured at different effective temperature intervals.
6 Selection function in the detection of metal-polluted white dwarfs
We complemented the photometric results from J-PLUS in the previous section with the spectroscopic values from the 40 pc sample (Sect. 6.1), derived from heterogeneous spectroscopy with a variety of sensitivities, and the SDSS DR16 spectroscopic sample (Sect. 6.2), which presents a homogeneous sensitivity. The three samples under study originated from the GF21 catalog and were selected by distance (40 pc sample), magnitude (r < 19.5 mag, J-PLUS), and colors (SDSS). Thus, we can combine the three datasets to learn about the selection of metal-polluted white dwarfs in the optical and better understand the impact of color selections on the SDSS spectroscopic sample.
6.1 J-PLUS and the 40 pc sample
The results from the 40 pc sample are presented in Fig. 8 and Table 2. We used the effective temperature and the mass derived using Gaia photometry and astrometry by GF21 assuming pure-H models for DA as principal type, and pure-He models at Teff < 6600 K and mixed models with log H/He = −5 otherwise for non-DAs. These choices were similar in the case of J-PLUS (Sect. 3), minimizing systematic differences in Teff and mass between both datasets. The same Teff bins and mass limit, M > 0.45 M⊙, as in the J-PLUS analysis were used to compute the fraction of white dwarfs with signs of metal pollution (DZ, DZA, DZB, DAZ, DBZ, and other hybrid types). Because of the low number statistics, the uncertainties were computed using the Bayesian binomial recipe in Cameron (2011). We find ƒCa ≈ 0.05 at Teff > 13 500 K, an increase in the fraction up to ƒCa ≈ 0.13 at Teff ~ 8000 K, and then a new plateau at lower temperatures. The fraction from the 40 pc sample is larger than in J-PLUS except at the lower temperature bin.
As is discussed in O’Brien et al. (2023), the detectability of metals in the spectra has a dependence on the resolution of the data: the larger the resolution, the lower the EW of the calcium (or any other metal) absorption than can be detected. Taking this into account, a mismatch between J-PLUS and the 40 pc sample is not surprising, and an offset is expected due to the different selection limits of both datasets. In this regard, an offset of +0.04 applied to the J-PLUS results reconciles the measurements at Teff > 8000 K.
However, the different sensitivity with the spectral resolution also affects the 40 pc sample, which gathers information from several instruments and works obtained with a diversity of configurations. We defined three tiers based on the resolution and the sensitivity to detect the presence of metal lines: tier 1 is composed by those data with R ~ 500–2000; tier 2 by the X-Shooter spectra, with a resolution of R = 5400 in the blue; and tier 3 by those classifications based on R > 18 500 spectra and with a measured calcium EW lower than 0.5 Å. When tier 3 objects are assumed as white dwarfs without metal pollution, this is, calcium should not be detected with the tier 1 and 2 configurations, we obtained a lower ƒCa at all temperatures (top right panel in Fig. 8). Indeed, all the metal-polluted objects at Teff > 12 000 K belong to tier 3 and ƒCa ~ 0 at the high-temperature end, in agreement with the J-PLUS results. The fractions at lower temperatures also agree with the J-PLUS model. As was stated before, the match between both works should be considered circumstantial and the relevant result is the consistent increase in the fraction of calcium white dwarfs found at Teff < 13 500 K by both datasets.
Finally, we also removed from the metal-polluted sample the white dwarfs in the tier 2 observed by X-Shooter (bottom left panel in Fig. 8). Following the previous discussion, the fraction of metal-polluted objects decreases in the lower temperature bins, the range where the X-Shooter spectra are concentrated. The trends are similar to the previous case, and therefore the conclusions are the same.
The fraction of calcium white dwarfs based on spectroscopy has a dependence on the instrumental setup of the observations. Nevertheless, the volume-limited 40 pc sample with heterogeneous spectroscopic information provides a consistent picture with the photometric results from J-PLUS, showing an increase in ƒCa at Teff < 13 500 K.
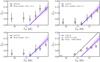 |
Fig. 8 Fraction of white dwarfs with calcium absorption (ƒCa) as a function of the effective temperature (Teff). The J-PLUS model and its 68% confidence interval are shown with the purple line and area, respectively. The squares show the fractions derived from the 40 pc sample for three different tiers with increasing sensitivity to the presence of metal lines (see text for details). The pentagons are the fractions estimated with the SDSS DR16 spectra gathered in the GF21 catalog. The dashed line depicts the J-PLUS model with an addition of 0.06. |
6.2 J-PLUS and the SDSS spectroscopic sample
We repeated the estimation in the fraction of calcium white dwarfs using the SDSS DR16 spectroscopic information included in the GF2l catalog. As in the 40 pc sample, the atmospheric parameters from GF2l were used, and the same effective temperature and mass ranges than in J-PLUS were assumed. In this case, all the SDSS DR16 data have a similar resolution. We minimized the impact of the different EW limit for spectra with different S/N by using only sources with S/N > S/Nmin at each temperature bin. We set S/Nmin to have a mean S/N ≈ 22.5 in all the considered bins. We also tested a common limit for all the sources and the results were similar. We summarized the obtained fraction of metal-polluted white dwarfs from SDSS DR16 spectroscopy in the bottom right panel of Fig. 8 and Table 2.
Compared with J-PLUS, the SDSS-based fractions are larger at Teff > 10000 K and smaller at lower effective temperatures. The trend is not consistent with the results from J-PLUS and the 40 pc sample, with an increase below Teff ~ 20 000 K and a plateau of ƒCa ≈ 0.075 at Teff ≲ 12000 K. The SDSS spectra share a similar resolution and S/N; thus, the main difference with respect to J-PLUS and the 40 pc sample is the additional color selection of SDSS spectroscopy. We recall that the three samples under consideration were initially selected from the GF2l catalog.
As was discussed in the previous section, an offset between the spectroscopy and J-PLUS is expected due to the different sensitivities. We can match J-PLUS and SDSS-based fractions at Teff > 12000 K by including a 0.06 increase to the J-PLUS fitting. However, the extrapolation of the J-PLUS trend to lower temperatures implies that SDSS spectra are selected against cool metal-polluted white dwarfs and the incompleteness at Teff ~ 7000 K could reach 50%.
The SDSS selection against cool, metal-polluted white dwarfs was already pointed out by Dufour et al. (2007) and Hollands et al. (2017). The SDSS programs for white dwarfs target the color space where non-polluted objects are expected (e.g., Kepler et al. 2016). Metal-polluted white dwarfs tend to have redder (u − ɡ) colors and the cooler ones have been discovered in SDSS spectra targeting quasars at redshifts larger than 2.5 (Hollands et al. 2017), far from the expected locus of non-polluted white dwarfs. Our results support this scenario.
6.3 Summary and future prospects
We found an increase in the fraction of white dwarfs with Ca II H+K absorption along the cooling sequence, growing from ƒCa ≈ 0 at Teff = 13 500 K to ƒCa ≈ 0.15 at Teff = 5500 K. This trend is observed in J-PLUS photometric data and in the 40 pc spectroscopic sample, both selected from the GF2l catalog. The SDSS DR16 spectra of the GF2l catalog present a deficit of metal-polluted white dwarfs at Teff < 12000 K. We conclude that this is due to the color selections affecting SDSS spectroscopy.
We discount the observed trends being dictated by the parallax (distance) distribution of the samples, as is presented in Fig. 9. On the one hand, the 40 pc has ϖ > 25 mas by definition. On the other hand, the J-PLUS and SDSS samples present similar distributions with a peak at ϖ ≈ 3 mas and a steady decrease at larger parallaxes. Despite the evident difference in the distance distribution, J-PLUS and the 40 pc provide compatible results.
This reinforces the color selection in SDSS spectroscopy as the source of the observed discrepancy.
As a consequence, the accretion rates and metal abundances of the white dwarf population based on SDSS spectroscopy should be affected by the aforementioned selection effect. The ongoing and future observations from the SDSS-V Milky Way mapper (Kollmeier et al. 2017), the William Herschel Telescope Enhanced Area Velocity Explorer (WEAVE, Dalton et al. 2012), the Dark Energy Spectroscopic Instrument (DESI, Allende Prieto et al. 2020), and the 4-meter Multi-Object Spectrograph Telescope (4MOST, Chiappini et al. 2019), which plan to follow up one hundred thousand white dwarfs from the GF2l catalog, will provide homogeneous spectroscopic datasets with a well-defined selection function to overcome the current SDSS limitations. In addition, these spectroscopic samples will test the trend found by both J-PLUS and the 40 pc sample.
Recently, the early data release (EDR) of DESI presented spectra for 2706 white dwarfs (Manser et al. 2024b). This permitted to analyze the metal-polluted fraction for objects with helium-dominated atmospheres, finding a nearly constant value of 0.21 ± 0.03 along the cooling sequence (Manser et al. 2024a). The comparison with DESI is beyond the scope of the present paper, and will be explored in the future.
Finally, the low-resolution (R ~ 30–90) blue and red photometer (BP and RP) spectra from Gaia DR3 (De Angeli et al. 2023; Montegriffo et al. 2023) have been used to select new metal-polluted candidates (García-Zamora et al. 2023; Vincent et al. 2024; Kao et al. 2024). This will provide additional data to estimate the fraction of calcium white dwarfs along the cooling sequence.
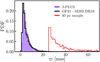 |
Fig. 9 Probability distribution function of the parallax (ϖ) for the J-PLUS sample (purple), the 40 pc sample (red), and the SDSS DR16 spectroscopic sample gathered in the GF21 catalog (black). |
7 Probability of presenting calcium absorption
As an application of our results, we estimated the probability of each individual white dwarf having calcium absorption. We assumed that a white dwarf can be in two states, s = {0,1}, corresponding to the absence (state 0) or presence (state 1) of calcium absorption. Using the results from the model D3 presented in Sect. 5.3, the probability of having calcium absorption was defined as
 (21)
(21)
where P(1) = FCa(Teff,a,b) is the prior for having calcium absorption, P (0) = 1 − P (1), and P (EWJ03951 s, σEW) was estimated with Eq. (10) using D = D0 for s = 0 and D = DCa for s=1.
The obtained pCa has two practical applications: it can be used to properly weigh and study the properties of the calcium white dwarf population (Sect. 7.1) and to provide high-confidence candidates of metal-polluted white dwarfs for spectroscopic follow-up (Sect. 7.2). These two applications also help to test the reliability of the results presented in Sect. 5.3.
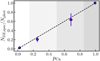 |
Fig. 10 Fraction of white dwarfs with metal-pollution from spectroscopy as a function of the probability of having calcium absorption from J-PLUS photometry, pCa (purple dots). The gray areas show the four intervals in pCa analyzed. The dashed line marks the one-to-one relation. |
7.1 Comparison with the spectroscopic classification
The performance of a binary classification problem can be assessed with the purity, completeness, and other summary statistics for a given selection threshold in the probability. Nevertheless, we are interested in the reliability of the computed probabilities, pCa. It can be estimated by comparing the fraction of spectroscopic metal-polluted white dwarfs for a spectroscopic sample selected in a range of pCa against the median pCa in that range. A one-to-one relation translates to a well-calibrated probability that provides the right fraction of true positives for a given pCa.
We used the 1393 white dwarfs with SDSS DR16 spectroscopic classification and S/N > 5 in the GF2l catalog of the sample with M > 0.45 M⊙ and 5500 < Teff < 30 000 K. We found 59 metal-polluted systems and 1334 white dwarfs without metal pollution, including DAs, DBs, DCs, DQs, and hybrid types without evidence of metals. The fraction of spectroscopic white dwarfs with metals as a function of pCa is presented in Fig. 10. The number of metal-polluted objects is limited, so we used four ranges with boundaries at pCa = [0,0.15,0.5,0.85,1]. The uncertainties were estimated from bootstrapping. The obtained values are compatible with the desired one-to-one relation, demonstrating the reliability of the computed pCa and reinforcing the temperature evolution derived in Sect. 5.3.
The probabilities, pCa, can therefore be used as priors in the analysis of the J-PLUS photometry when models of metal-polluted atmospheres are used, properly weighting the likelihood of different spectral types and solving the degeneracy problem exposed in Sect. 3. This will be addressed in a future work.
White dwarfs in J-PLUS DR2 with a probability of having calcium absorption of pCa > 0.99.
7.2 Spectroscopic confirmation of new metal-polluted white dwarfs
As a direct application of the derived probabilities, we selected white dwarfs with pCa ≥ 0.99 from the final sample. We obtained a total of 39 high-confidence candidates, as is summarized in Table 3. We searched for information in the Montreal white dwarf database3 (Dufour et al. 2017) and Simbad4 (Wenger et al. 2000), finding spectroscopic information for 20 of them. All are classified as metal-polluted white dwarfs.
Thus, we have 19 high-confidence candidates for new, metal-polluted systems. We performed the observing run GTC111-21A with the Optical System for Imaging and low-Intermediate-Resolution Integrated Spectroscopy (OSIRIS) instrument at Gran Telescopio Canarias (GTC) to follow up on six of these sources. The R1000B grism covering the 3600 Å to 7500 Å range and a long slit of 0.6″ were used, providing a dispersion of 2.1 Å pix−1 at 5455 Å. Three exposures per target with an on-source time ranging from 100 s to 750 s each, depending on the magnitude of the source, were acquired. A standard reduction, including wavelength and flux calibration, was performed. The spectra confirmed all the candidates as metal-polluted white dwarfs (Fig. 11). The analysis of the abundances in these systems deserves a dedicated work.
With the addition of our new objects, 26 of the 39 high-confidence candidates have spectroscopic information with a purity of 100% for the presence of polluting metals. This was expected due to the high probability imposed for the presence of calcium absorption.
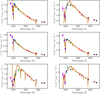 |
Fig. 11 Six metal-polluted white dwarfs from the high-confidence J-PLUS sample confirmed with spectra from OSIRIS at GTC (brown lines). The symbols showing the J-PLUS photometry follow Fig. 1. The spectra have been scaled to the r-band flux from J-PLUS. |
8 Conclusions
We used the J-PLUS DR2 photometry in 12 optical bands over 2176 deg2 to estimate the fraction of white dwarfs with presence of Ca II H+K absorption along the cooling sequence. The 100 Å width J0395 passband in J-PLUS is sensitive to calcium absorption. We compared the photometry in the remaining 11 J-PLUS passbands using metal-free models to estimate the expected unpolluted continuum at J0395. This continuum was compared with the observed J0395 flux to estimate its EW, EWJ0395. In addition, the effective temperature and the mass were estimated.
The J-PLUS + Gaia sample of 5926 white dwarfs presented in López-Sanjuan et al. (2022a) was analyzed. We compared our photometric measurements with the Ca/He abundances and the effective temperatures from the spectroscopic study of Coutu et al. (2019) for the 47 objects in common between both samples. We found that EWJ0395 is a robust proxy for the presence of Ca II H+K absorption. In addition, the J-PLUS temperatures are 4% larger than those in Coutu et al. (2019).
Accounting for the limitations in our methodology and to avoid double degenerate systems, a total of 4399 white dwarfs with effective temperatures of 30000 > Teff > 5500 K and masses of M > 0.45 M⊙ were finally used. Their EWJ0395 distribution was modeled with two populations, corresponding to polluted and non-polluted systems, to estimate the fraction of calcium white dwarfs (fCa) as a function of Teff. The observational errors were accounted for in the process by adopting a Bayesian formalism.
We found that the fraction of calcium white dwarfs varies along the cooling sequence, increasing from fCa ≈ 0 at Teff = 13 500 K to fca ≈ 0.15 at Teff = 5500 K. This trend reflects the selection function of metal-polluted systems in the optical, with an increase in the Ca II H+K EW at a fixed abundance toward lower effective temperatures. We compared our results with the fractions obtained from the 40 pc spectroscopic sample and the SDSS DR16 spectra gathered by GF21. The J-PLUS trend is also present in the 40 pc sample; however, SDSS presents a deficit of metal-polluted objects at Teff < 12 000 K, probably due to the color selection of SDSS spectroscopic targets.
Finally, the probability of having calcium absorption for a white dwarf, pCa, was computed. The comparison with the spectral classification shows that the derived probabilities are reliable, providing the right fraction of true positives for a given pCa. We selected 39 white dwarfs with pCa > 0.99, 20 of which have available spectra from the literature and six of which were followed up with OSIRIS at GTC. We confirm that all 26 of these objects are metal-polluted systems.
Our results imply that the distributions of accretion rates and metal abundances of the white dwarf population based on SDSS spectroscopy are affected by the color selection. The ongoing and future spectroscopic observations from SDSS-V Milky Way mapper, WEAVE, DESI, and 4-MOST will gather homogeneous spectroscopic datasets to overcome the current SDSS limitations. In addition, the low-resolution (R ~ 30–90) BP and RP spectra from Gaia DR3 and future data releases will also provide valuable information for the white dwarf population (Carrasco et al. 2014; Gaia Collaboration 2023; Jiménez-Esteban et al. 2023; Torres et al. 2023; García-Zamora et al. 2023; Vincent et al. 2024; Kao et al. 2024).
As a final consideration, a precise characterization of the selection function of the GF21 catalog is also essential. The G21 catalog is based on Gaia EDR3 and is used by the aforementioned spectroscopic projects as a parent sample to select their targets. We envision the J-PAS photometric data as the most promising tool to derive the selection function of present and future Gaia-based catalogs for white dwarfs. As is illustrated by López-Sanjuan et al. (2022b) with miniJPAS data, the first square degree observed with the 54 narrow bands of J-PAS to a nominal depth (Bonoli et al. 2021), the J-PAS low-resolution (R ~ 50) photo-spectra are able to provide atmospheric compositions (H- and He-dominated) and detect metal pollution down to r = 21.5 mag for 22000 > Teff > 7000 K white dwarfs. Moreover, a pure photometric analysis using J-PAS data alone is able to distinguish between white dwarfs and extragalactic quasars. Because J-PAS is deeper than Gaia, it will provide an independent dataset to test the Gaia selection function of metal-polluted white dwarfs and unique, faint candidates for spectroscopic follow-up.
Data availability
The catalog with the parameters of the analyzed white dwarfs is available both on the jplus.WhiteDwarf table at J-PLUS database and at the CDS via anonymous ftp to cdsarc.cds.unistra.fr (130.79.128.5) or via https://cdsarc.cds.unistra.fr/viz-bin/cat/J/A+A/691/A211.
Acknowledgements
We dedicate this paper to the memory of our six IAC colleagues and friends who met with a fatal accident in Piedra de los Cochinos, Tenerife, in February 2007, with special thanks to Maurizio Panniello, whose teachings of python were so important for this paper. We thank the discussions with the members of the J-PLUS collaboration. We thank the anonymous referee for useful comments and suggestions. Based on observations made with the JAST80 telescope at the Observatorio Astrofísico de Javalam-bre (OAJ), in Teruel, owned, managed, and operated by the Centro de Estudios de Física del Cosmos de Aragón. We acknowledge the OAJ Data Processing and Archiving Unit (UPAD, Cristóbal-Hornillos et al. 2012) for reducing and calibrating the OAJ data used in this work. Partially based on observations made with the Gran Telescopio Canarias (GTC), installed at the Spanish Observatorio del Roque de los Muchachos of the Instituto de Astrofísica de Canarias, on the island of La Palma, and with the instrument OSIRIS, built by a Consortium led by the Instituto de Astrofísica de Canarias in collaboration with the Instituto de Astronomía of the Universidad Autónoma de México. OSIRIS was funded by GRANTECAN and the National Plan of Astronomy and Astrophysics of the Spanish Government. Funding for the J-PLUS Project has been provided by the Governments of Spain and Aragón through the Fondo de Inversiones de Teruel; the Aragonese Government through the Research Groups E96, E103, E16_17R, E16_20R, and E16_23R; the Spanish Ministry of Science and Innovation (MCIN/AEI/10.13039/501100011033 y FEDER, Una manera de hacer Europa) with grants PID2021-124918NB-C41, PID2021-124918NB-C42, PID2021-124918NA-C43, and PID2021-124918NB-C44; the Spanish Ministry of Science, Innovation and Universities (MCIU/AEI/FEDER, UE) with grants PGC2018-097585-B-C21 and PGC2018-097585-B-C22; the Spanish Ministry of Economy and Competitiveness (MINECO) under AYA2015-66211-C2-1-P, AYA2015-66211-C2-2, AYA2012-30789, and ICTS-2009-14; and European FEDER funding (FCDD10-4E-867, FCDD13-4E-2685). The Brazilian agencies FINEP, FAPESP, and the National Observatory of Brazil have also contributed to this project. P.-E. T. and M. W. O. have received funding from the European Research Council under the European Union’s Horizon 2020 research and innovation programme number 101002408 (MOS100PC). The work by J.M. Carrasco was (partially) supported by the Spanish MICIN/AEI/10.13039/501100011033 and by “ERDF A way of making Europe” by the “European Union” through grant PID2021-122842OB-C21, and the Institute of Cosmos Sciences University of Barcelona (ICCUB, Unidad de Excelencia 'María de Maeztu') through grant CEX2019-000918-M. A. E., A. d. P., H. D. S., and J. A. F. O. acknowledge the financial support from the Spanish Ministry of Science and Innovation and the European Union - NextGenerationEU through the Recovery and Resilience Facility project ICTS-MRR-2021-03-CEFCA. F. J. E acknowledge financial support from MCIN/AEI/10.13039/501100011033 through grant PID2020-112949GB-I00. A. R. M. acknowledges support by the Spanish MINECO grant PID2020-117252GB-I00 and by the AGAUR/Generalitat de Catalunya grant SGR-386/2021. J. V. acknowledges the technical members of the UPAD for their invaluable work: Juan Castillo, Javier Hernandez, Ángel López, Alberto Moreno, David Muniesa, and Hector Vives. This work has made use of data from the European Space Agency (ESA) mission Gaia (https://www.cosmos.esa.int/gaia), processed by the Gaia Data Processing and Analysis Consortium (DPAC, https://www.cosmos.esa.int/web/gaia/dpac/consortium). Funding for the DPAC has been provided by national institutions, in particular the institutions participating in the Gaia Multilateral Agreement. Funding for SDSS-III has been provided by the Alfred P. Sloan Foundation, the Participating Institutions, the National Science Foundation, and the U.S. Department of Energy Office of Science. The SDSS-III web site is http://www.sdss3.org/. SDSS-III is managed by the Astrophysical Research Consortium for the Participating Institutions of the SDSS-III Collaboration including the University of Arizona, the Brazilian Participation Group, Brookhaven National Laboratory, Carnegie Mellon University, University of Florida, the French Participation Group, the German Participation Group, Harvard University, the Instituto de Astrofisica de Canarias, the Michigan State/Notre Dame/JINA Participation Group, Johns Hopkins University, Lawrence Berkeley National Laboratory, Max Planck Institute for Astrophysics, Max Planck Institute for Extraterrestrial Physics, New Mexico State University, New York University, Ohio State University, Pennsylvania State University, University of Portsmouth, Princeton University, the Spanish Participation Group, University of Tokyo, University of Utah, Vanderbilt University, University of Virginia, University of Washington, and Yale University. Funding for the Sloan Digital Sky Survey IV has been provided by the Alfred P. Sloan Foundation, the U.S. Department of Energy Office of Science, and the Participating Institutions. SDSS-IV acknowledges support and resources from the Center for High Performance Computing at the University of Utah. The SDSS website is www.sdss.org. SDSS-IV is managed by the Astrophysical Research Consortium for the Participating Institutions of the SDSS Collaboration including the Brazilian Participation Group, the Carnegie Institution for Science, Carnegie Mellon University, Center for Astrophysics | Harvard & Smithsonian, the Chilean Participation Group, the French Participation Group, Instituto de Astrofísica de Canarias, The Johns Hopkins University, Kavli Institute for the Physics and Mathematics of the Universe (IPMU) / University of Tokyo, the Korean Participation Group, Lawrence Berkeley National Laboratory, Leibniz Institut für Astrophysik Potsdam (AIP), Max-Planck-Institut für Astronomie (MPIA Heidelberg), Max-Planck-Institut für Astrophysik (MPA Garching), Max-Planck-Institut für Extraterrestrische Physik (MPE), National Astronomical Observatories of China, New Mexico State University, New York University, University of Notre Dame, Observatário Nacional / MCTI, The Ohio State University, Pennsylvania State University, Shanghai Astronomical Observatory, United Kingdom Participation Group, Universidad Nacional Autónoma de México, University of Arizona, University of Colorado Boulder, University of Oxford, University of Portsmouth, University of Utah, University of Virginia, University of Washington, University of Wisconsin, Vanderbilt University, and Yale University. This research made use of Astropy, a community-developed core Python package for Astronomy (Astropy Collaboration 2013), and Matplotlib, a 2D graphics package used for Python for publication-quality image generation across user interfaces and operating systems (Hunter 2007).
Appendix A J-PLUS filter system
The J-PLUS passbands, including the filter transmission, CCD efficiency, telescope optics, and atmosphere, are presented in Table A.1.
J-PLUS filter system.
Appendix B Catalog of white dwarf parameters
In this appendix, we describe the data of the 5926 white dwarfs analyzed in the present paper. The gathered information is in the J-PLUS database at the table jplus.WhiteDwarf, also accessible through virtual observatory table access protocol (TAP) service. The catalog is also provided at CDS. The description of the columns is provided in Table. B.1.
The information in the catalog is also accessible with the J-PLUS explorer for individual objects, including a graphical view of the best-fit solution as in Fig. 2.
White dwarf catalog of atmospheric parameters and calcium EWs.
References
- Ahumada, R., Prieto, C. A., Almeida, A., et al. 2020, ApJS, 249, 3 [Google Scholar]
- Allende Prieto, C., Cooper, A. P., Dey, A., et al. 2020, RNAAS, 4, 188 [NASA ADS] [Google Scholar]
- Astropy Collaboration (Robitaille, T. P., et al.) 2013, A&A, 558, A33 [NASA ADS] [CrossRef] [EDP Sciences] [Google Scholar]
- Benítez, N., Dupke, R., Moles, M., et al. 2014, arXiv e-prints [arXiv: 1403.5237] [Google Scholar]
- Bergeron, P., Dufour, P., Fontaine, G., et al. 2019, ApJ, 876, 67 [NASA ADS] [CrossRef] [Google Scholar]
- Bertin, E., & Arnouts, S. 1996, A&AS, 117, 393 [NASA ADS] [CrossRef] [EDP Sciences] [Google Scholar]
- Blouin, S. 2020, MNRAS, 496, 1881 [CrossRef] [Google Scholar]
- Blouin, S., & Xu, S. 2022, MNRAS, 510, 1059 [Google Scholar]
- Bonoli, S., Marín-Franch, A., Varela, J., et al. 2021, A&A, 653, A31 [NASA ADS] [CrossRef] [EDP Sciences] [Google Scholar]
- Cameron, E. 2011, PASA, 28, 128 [Google Scholar]
- Carrasco, J. M., Catalán, S., Jordi, C., et al. 2014, A&A, 565, A11 [NASA ADS] [CrossRef] [EDP Sciences] [Google Scholar]
- Carter, P. J., Marsh, T.R., Steeghs, D., et al. 2013, MNRAS, 429, 2143 [NASA ADS] [CrossRef] [Google Scholar]
- Cenarro, A. J., Moles, M., Marín-Franch, A., et al. 2014, Proc. SPIE, 9149, 91491I [Google Scholar]
- Cenarro, A. J., Moles, M., Cristóbal-Hornillos, D., et al. 2019, A&A, 622, A176 [NASA ADS] [CrossRef] [EDP Sciences] [Google Scholar]
- Chiappini, C., Minchev, I., Starkenburg, E., et al. 2019, The Messenger, 175, 30 [NASA ADS] [Google Scholar]
- Coutu, S., Dufour, P., Bergeron, P., et al. 2019, ApJ, 885, 74 [NASA ADS] [CrossRef] [Google Scholar]
- Cristóbal-Hornillos, D., Gruel, N., Varela, J., et al. 2012, in SPIE Conf. Ser., 8451 [Google Scholar]
- Cukanovaite, E., Tremblay, P. E., Freytag, B., Ludwig, H. G., & Bergeron, P. 2018, MNRAS, 481, 1522 [NASA ADS] [CrossRef] [Google Scholar]
- Cukanovaite, E., Tremblay, P. E., Freytag, B., et al. 2019, MNRAS, 490, 1010 [CrossRef] [Google Scholar]
- Dalton, G., Trager, S. C., Abrams, D. C., et al. 2012, SPIE Conf. Ser., 8446, 84460P [Google Scholar]
- De Angeli, F., Weiler, M., Montegriffo, P., et al. 2023, A&A, 674, A2 [NASA ADS] [CrossRef] [EDP Sciences] [Google Scholar]
- Dufour, P., Bergeron, P., Liebert, J., et al. 2007, ApJ, 663, 1291 [NASA ADS] [CrossRef] [Google Scholar]
- Dufour, P., Blouin, S., Coutu, S., et al. 2017, in Astronomical Society of the Pacific Conference Series, 509, 20th European White Dwarf Workshop, eds. P. E. Tremblay, B. Gaensicke, & T. Marsh, 3 [Google Scholar]
- Eisenstein, D. J., Liebert, J., Harris, H. C., et al. 2006, ApJS, 167, 40 [CrossRef] [Google Scholar]
- Farihi, J., Jura, M., Lee, J. E., & Zuckerman, B. 2010, ApJ, 714, 1386 [NASA ADS] [CrossRef] [Google Scholar]
- Fontaine, G., Brassard, P., & Bergeron, P. 2001, PASP, 113, 409 [NASA ADS] [CrossRef] [Google Scholar]
- Foreman-Mackey, D., Hogg, D. W., Lang, D., & Goodman, J. 2013, PASP, 125, 306 [Google Scholar]
- Gaia Collaboration (Prusti, T., et al.) 2016, A&A, 595, A1 [NASA ADS] [CrossRef] [EDP Sciences] [Google Scholar]
- Gaia Collaboration (Brown, A. G. A., et al.) 2021, A&A, 649, A1 [NASA ADS] [CrossRef] [EDP Sciences] [Google Scholar]
- Gaia Collaboration (Montegriffo, P., et al.) 2023, A&A, 674, A33 [CrossRef] [EDP Sciences] [Google Scholar]
- García-Zamora, E. M., Torres, S., & Rebassa-Mansergas, A. 2023, A&A, 679, A127 [NASA ADS] [CrossRef] [EDP Sciences] [Google Scholar]
- Gentile Fusillo, N. P., Gänsicke, B. T., & Greiss, S. 2015, MNRAS, 448, 2260 [NASA ADS] [CrossRef] [Google Scholar]
- Gentile Fusillo, N. P., Tremblay, P.-E., Bohlin, R. C., Deustua, S. E., & Kalirai, J. S. 2020, MNRAS, 491, 3613 [NASA ADS] [CrossRef] [Google Scholar]
- Gentile Fusillo, N. P., Tremblay, P. E., Cukanovaite, E., et al. 2021, MNRAS, 508, 3877 [NASA ADS] [CrossRef] [Google Scholar]
- Giammichele, N., Bergeron, P., & Dufour, P. 2012, ApJS, 199, 29 [Google Scholar]
- Goodman, J., & Weare, J. 2010, Commun. Appl. Math. Comp. Sci., 5, 65 [NASA ADS] [CrossRef] [Google Scholar]
- Hollands, M. A., Koester, D., Alekseev, V., Herbert, E. L., & Gänsicke, B. T. 2017, MNRAS, 467, 4970 [NASA ADS] [Google Scholar]
- Hollands, M. A., Gänsicke, B. T., & Koester, D. 2018a, MNRAS, 477, 93 [NASA ADS] [CrossRef] [Google Scholar]
- Hollands, M. A., Tremblay, P. E., Gänsicke, B. T., Gentile-Fusillo, N. P., & Toonen, S. 2018b, MNRAS, 480, 3942 [NASA ADS] [CrossRef] [Google Scholar]
- Hunter, J. D. 2007, Comput. Sci. Eng., 9, 90 [NASA ADS] [CrossRef] [Google Scholar]
- Jiménez-Esteban, F. M., Torres, S., Rebassa-Mansergas, A., et al. 2023, MNRAS, 518, 5106 [Google Scholar]
- Jura, M. 2003, ApJ, 584, L91 [Google Scholar]
- Jura, M. 2008, AJ, 135, 1785 [NASA ADS] [CrossRef] [Google Scholar]
- Kao, M. L., Hawkins, K., Rogers, L. K., et al. 2024, ApJ, 970, 181 [NASA ADS] [CrossRef] [Google Scholar]
- Kepler, S. O., Pelisoli, I., Koester, D., et al. 2015, MNRAS, 446, 4078 [Google Scholar]
- Kepler, S. O., Pelisoli, I., Koester, D., et al. 2016, MNRAS, 455, 3413 [NASA ADS] [CrossRef] [Google Scholar]
- Kepler, S. O., Pelisoli, I., Koester, D., et al. 2019, MNRAS, 486, 2169 [NASA ADS] [Google Scholar]
- Kilic, M., Bergeron, P., Kosakowski, A., et al. 2020, ApJ, 898, 84 [Google Scholar]
- Kleinman, S. J., Harris, H. C., Eisenstein, D. J., et al. 2004, ApJ, 607, 426 [NASA ADS] [CrossRef] [Google Scholar]
- Kleinman, S. J., Kepler, S. O., Koester, D., et al. 2013, ApJS, 204, 5 [NASA ADS] [CrossRef] [Google Scholar]
- Koester, D. 2009, A&A, 498, 517 [NASA ADS] [CrossRef] [EDP Sciences] [Google Scholar]
- Koester, D. 2010, Mem. Soc. Astron. Italiana, 81, 921 [NASA ADS] [Google Scholar]
- Koester, D., & Wilken, D. 2006, A&A, 453, 1051 [NASA ADS] [CrossRef] [EDP Sciences] [Google Scholar]
- Koester, D., Rollenhagen, K., Napiwotzki, R., et al. 2005, A&A, 432, 1025 [NASA ADS] [CrossRef] [EDP Sciences] [Google Scholar]
- Koester, D., Girven, J., Gänsicke, B. T., & Dufour, P. 2011, A&A, 530, A114 [NASA ADS] [CrossRef] [EDP Sciences] [Google Scholar]
- Koester, D., Gänsicke, B. T., & Farihi, J. 2014, A&A, 566, A34 [NASA ADS] [CrossRef] [EDP Sciences] [Google Scholar]
- Kollmeier, J. A., Zasowski, G., Rix, H.-W., et al. 2017, arXiv [arXiv:1711.03234] [Google Scholar]
- Kong, X., Luo, A. L., & Li, X.-R. 2019, Res. Astron. Astrophys., 19, 088 [CrossRef] [Google Scholar]
- Limoges, M. M., Lépine, S., & Bergeron, P. 2013, AJ, 145, 136 [CrossRef] [Google Scholar]
- Limoges, M. M., Bergeron, P., & Lépine, S. 2015, ApJS, 219, 19 [NASA ADS] [CrossRef] [Google Scholar]
- Lindegren, L., Bastian, U., Biermann, M., et al. 2021a, A&A, 649, A4 [EDP Sciences] [Google Scholar]
- Lindegren, L., Klioner, S. A., Hernández, J., et al. 2021b, A&A, 649, A2 [EDP Sciences] [Google Scholar]
- Lodders, K. 2003, ApJ, 591, 1220 [Google Scholar]
- López-Sanjuan, C., Yuan, H., Vázquez Ramió, H., et al. 2021, A&A, 654, A61 [NASA ADS] [CrossRef] [EDP Sciences] [Google Scholar]
- López-Sanjuan, C., Tremblay, P. E., Ederoclite, A., et al. 2022a, A&A, 658, A79 [NASA ADS] [CrossRef] [EDP Sciences] [Google Scholar]
- López-Sanjuan, C., Tremblay, P. E., Ederoclite, A., et al. 2022b, A&A, 665, A151 [NASA ADS] [CrossRef] [EDP Sciences] [Google Scholar]
- Manser, C. J., Gänsicke, B. T., Izquierdo, P, et al. 2024a, MNRAS, 531, L27 [NASA ADS] [CrossRef] [Google Scholar]
- Manser, C. J., Izquierdo, P., Gänsicke, B. T., et al. 2024b, MNRAS, submitted arXiv [arXiv:2402.18641] [Google Scholar]
- Marín-Franch, A., Taylor, K., Cenarro, J., Cristobal-Hornillos, D., & Moles, M. 2015, in IAU General Assembly, 29, 2257381 [Google Scholar]
- McCleery, J., Tremblay, P.-E., Gentile Fusillo, N. P., et al. 2020, MNRAS, 499, 1890 [Google Scholar]
- Mendes de Oliveira, C., Ribeiro, T., Schoenell, W., et al. 2019, MNRAS, 489, 241 [NASA ADS] [CrossRef] [Google Scholar]
- Montegriffo, P., De Angeli, F., Andrae, R., et al. 2023, A&A, 674, A3 [NASA ADS] [CrossRef] [EDP Sciences] [Google Scholar]
- O’Brien, M. W., Tremblay, P. E., Gentile Fusillo, N. P., et al. 2023, MNRAS, 518, 3055 [Google Scholar]
- O’Brien, M. W., Tremblay, P. E., Klein, B. L., et al. 2024, MNRAS, 527, 8687 [Google Scholar]
- Oke, J. B., & Gunn, J. E. 1983, ApJ, 266, 713 [NASA ADS] [CrossRef] [Google Scholar]
- Pancino, E., Altavilla, G., Marinoni, S., et al. 2012, MNRAS, 426, 1767 [Google Scholar]
- Pancino, E., Sanna, N., Altavilla, G., et al. 2021, MNRAS, 503, 3660 [Google Scholar]
- Schwarz, G. 1978, Ann. Statist., 6, 461 [Google Scholar]
- Starkenburg, E., Martin, N., Youakim, K., et al. 2017, MNRAS, 471, 2587 [NASA ADS] [CrossRef] [Google Scholar]
- Torres, S., Cruz, P., Murillo-Ojeda, R., et al. 2023, A&A, 677, A159 [NASA ADS] [CrossRef] [EDP Sciences] [Google Scholar]
- Tremblay, P. E., Bergeron, P., & Gianninas, A. 2011, ApJ, 730, 128 [Google Scholar]
- Tremblay, P. E., Ludwig, H. G., Steffen, M., & Freytag, B. 2013, A&A, 559, A104 [NASA ADS] [CrossRef] [EDP Sciences] [Google Scholar]
- Tremblay, P. E., Hollands, M. A., Gentile Fusillo, N. P., et al. 2020, MNRAS, 497, 130 [NASA ADS] [CrossRef] [Google Scholar]
- Turner, S. G. D., & Wyatt, M. C. 2020, MNRAS, 491, 4672 [NASA ADS] [Google Scholar]
- Vincent, O., Barstow, M. A., Jordan, S., et al. 2024, A&A, 682, A5 [NASA ADS] [CrossRef] [EDP Sciences] [Google Scholar]
- Wenger, M., Ochsenbein, F., Egret, D., et al. 2000, A&AS, 143, 9 [NASA ADS] [CrossRef] [EDP Sciences] [Google Scholar]
- Zuckerman, B., Koester, D., Reid, I. N., & Hünsch, M. 2003, ApJ, 596, 477 [Google Scholar]
- Zuckerman, B., Melis, C., Klein, B., Koester, D., & Jura, M. 2010, ApJ, 722, 725 [Google Scholar]
All Tables
Fraction of calcium white dwarfs measured at different effective temperature intervals.
White dwarfs in J-PLUS DR2 with a probability of having calcium absorption of pCa > 0.99.
All Figures
|
Fig. 1 Spectral energy distribution of van Maanen 2 (left panel) and LP 401-31 (right panel), two metal-polluted white dwarfs. The colored symbols in both panels are the 3 arcsec diameter aperture photometry corrected to total flux from J-PLUS: squares for broad bands, u𝑔riz; circles for medium bands of width ranging from 10 nm to 40 nm, J0378, J0395, J0410, J0430, J0515, J0660, and J0861 (see Table A.1 for details). The passband J0395 of 10 nm width is the most sensitive to the presence of Ca II H+K absorption. The brown line shows the spectrum of the source from the Gaia spectro-photometric standard stars survey (Pancino et al. 2012, 2021, left panel) and Limoges et al. (2015, right panel). The unique J-PLUS identification, composed of the TILE_ID of the reference r-band image and the NUMBER assigned by SExtractor to the source, is reported in the panels for reference. |
| In the text | |
|
Fig. 2 Illustrative example for the estimation of the 70395 EW, EWJ0395, in WD 1529+428, a DZ with spectroscopic information from SDSS (left panel). Symbols are showing the J-PLUS photometry as in Fig. 1. The gray diamonds connected with a solid line in the right panel depict the best-fit solution to J-PLUS photometry but the J0395 passband, with the derived parameters and their uncertainties labeled: effective temperature (Teff), surface gravity (log g) and parallax (ϖ). The white diamond represents the expected continuum flux in the 70395 filter in absence of polluting metals from the fitting process, see Eq. (7). The estimated 70395 EW is also presented in the panel. |
| In the text | |
|
Fig. 3 Calcium relative abundance, log Ca/Не, as a function of effective temperature, |
| In the text | |
|
Fig. 4 Effective temperature from J-PLUS photometry, |
| In the text | |
|
Fig. 5 Left panels: EWJ0395 as a function of the effective temperature from J-PLUS photometry (black bullets). The top panels show the 38 white dwarfs with a metal dominant type (DZ, DZA, DZB, etc.) and the bottom panels the 21 white dwarfs with a non-dominant metal type (DAZ, DBZ, etc.) as purple circles. The spectroscopic type is from GF2l for SDSS DR16 spectra with S/N ≥ 5. Right panels: cumulative distribution function (CDF) in EWJo395 for the total sample (black) and the metal-polluted sample (purple). The black and purple circles with error bars depict the median and the [16,84] percentiles of the distribution. |
| In the text | |
|
Fig. 6 Probability distribution function of the observed EWJo395 (black histogram). The left panel shows the best-fit D2 model and its 68% confidence interval with the red line and area, respectively. The best-fit parameters are labeled in the panel. The purple line and area show the median distribution and its 68% confidence interval obtained from 5000 random samples extracted from D2 and affected by the same uncertainties, σEW, as the observations. The right panel is similar to the left panel but for the baseline model, D0. |
| In the text | |
|
Fig. 7 Fraction of white dwarfs with calcium absorption (ƒCa) as a function of the effective temperature (Teff). The best-fit FCa model and its 68% confidence interval are shown with the purple line and area, respectively. The parameters of the linear trend from Eq. (20) are presented in the panel. The purple dots depict the fractions obtained with the temperature-independent model D2 at different Teff intervals. |
| In the text | |
|
Fig. 8 Fraction of white dwarfs with calcium absorption (ƒCa) as a function of the effective temperature (Teff). The J-PLUS model and its 68% confidence interval are shown with the purple line and area, respectively. The squares show the fractions derived from the 40 pc sample for three different tiers with increasing sensitivity to the presence of metal lines (see text for details). The pentagons are the fractions estimated with the SDSS DR16 spectra gathered in the GF21 catalog. The dashed line depicts the J-PLUS model with an addition of 0.06. |
| In the text | |
|
Fig. 9 Probability distribution function of the parallax (ϖ) for the J-PLUS sample (purple), the 40 pc sample (red), and the SDSS DR16 spectroscopic sample gathered in the GF21 catalog (black). |
| In the text | |
|
Fig. 10 Fraction of white dwarfs with metal-pollution from spectroscopy as a function of the probability of having calcium absorption from J-PLUS photometry, pCa (purple dots). The gray areas show the four intervals in pCa analyzed. The dashed line marks the one-to-one relation. |
| In the text | |
|
Fig. 11 Six metal-polluted white dwarfs from the high-confidence J-PLUS sample confirmed with spectra from OSIRIS at GTC (brown lines). The symbols showing the J-PLUS photometry follow Fig. 1. The spectra have been scaled to the r-band flux from J-PLUS. |
| In the text | |
Current usage metrics show cumulative count of Article Views (full-text article views including HTML views, PDF and ePub downloads, according to the available data) and Abstracts Views on Vision4Press platform.
Data correspond to usage on the plateform after 2015. The current usage metrics is available 48-96 hours after online publication and is updated daily on week days.
Initial download of the metrics may take a while.