Fig. 1
Download original image
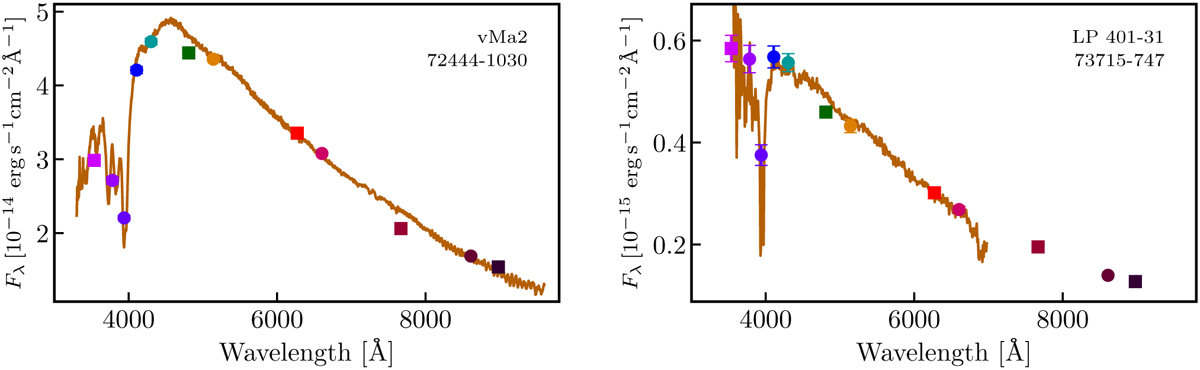
Spectral energy distribution of van Maanen 2 (left panel) and LP 401-31 (right panel), two metal-polluted white dwarfs. The colored symbols in both panels are the 3 arcsec diameter aperture photometry corrected to total flux from J-PLUS: squares for broad bands, u𝑔riz; circles for medium bands of width ranging from 10 nm to 40 nm, J0378, J0395, J0410, J0430, J0515, J0660, and J0861 (see Table A.1 for details). The passband J0395 of 10 nm width is the most sensitive to the presence of Ca II H+K absorption. The brown line shows the spectrum of the source from the Gaia spectro-photometric standard stars survey (Pancino et al. 2012, 2021, left panel) and Limoges et al. (2015, right panel). The unique J-PLUS identification, composed of the TILE_ID of the reference r-band image and the NUMBER assigned by SExtractor to the source, is reported in the panels for reference.
Current usage metrics show cumulative count of Article Views (full-text article views including HTML views, PDF and ePub downloads, according to the available data) and Abstracts Views on Vision4Press platform.
Data correspond to usage on the plateform after 2015. The current usage metrics is available 48-96 hours after online publication and is updated daily on week days.
Initial download of the metrics may take a while.