Fig. 6
Download original image
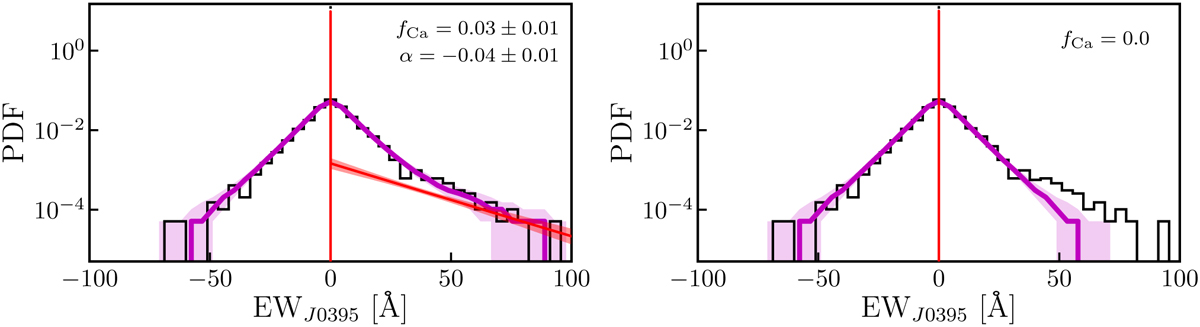
Probability distribution function of the observed EWJo395 (black histogram). The left panel shows the best-fit D2 model and its 68% confidence interval with the red line and area, respectively. The best-fit parameters are labeled in the panel. The purple line and area show the median distribution and its 68% confidence interval obtained from 5000 random samples extracted from D2 and affected by the same uncertainties, σEW, as the observations. The right panel is similar to the left panel but for the baseline model, D0.
Current usage metrics show cumulative count of Article Views (full-text article views including HTML views, PDF and ePub downloads, according to the available data) and Abstracts Views on Vision4Press platform.
Data correspond to usage on the plateform after 2015. The current usage metrics is available 48-96 hours after online publication and is updated daily on week days.
Initial download of the metrics may take a while.