Fig. 4
Download original image
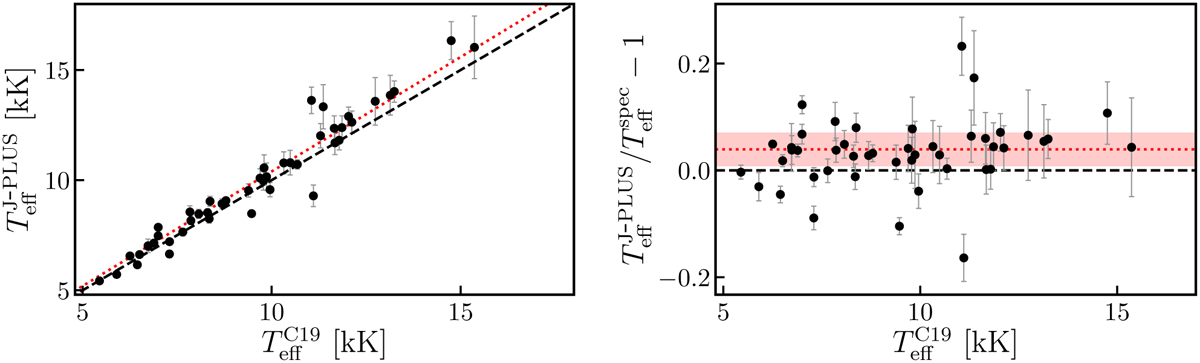
Effective temperature from J-PLUS photometry, ![]() , as a function of the value derived by Coutu et al. (2019),
, as a function of the value derived by Coutu et al. (2019), ![]() (left panel). The dashed black line marks the one-to-one relation and the dotted red line a 4% overestimation from J-PLUS with respect to the temperature from Coutu et al. (2019). Right panel: relative difference between effective temperatures as a function of
(left panel). The dashed black line marks the one-to-one relation and the dotted red line a 4% overestimation from J-PLUS with respect to the temperature from Coutu et al. (2019). Right panel: relative difference between effective temperatures as a function of ![]() . The dashed black line marks a zero difference and the dotted red line a 4% overestimation. The red area encloses 68% of the points and it is equivalent to a 3% dispersion.
. The dashed black line marks a zero difference and the dotted red line a 4% overestimation. The red area encloses 68% of the points and it is equivalent to a 3% dispersion.
Current usage metrics show cumulative count of Article Views (full-text article views including HTML views, PDF and ePub downloads, according to the available data) and Abstracts Views on Vision4Press platform.
Data correspond to usage on the plateform after 2015. The current usage metrics is available 48-96 hours after online publication and is updated daily on week days.
Initial download of the metrics may take a while.