| Issue |
A&A
Volume 691, November 2024
|
|
|---|---|---|
| Article Number | A36 | |
| Number of page(s) | 15 | |
| Section | Stellar structure and evolution | |
| DOI | https://doi.org/10.1051/0004-6361/202450955 | |
| Published online | 29 October 2024 | |
X-ray and optical observations of the millisecond pulsar binary PSR J1431–4715
1
INAF-Osservatorio Astronomico di Capodimonte, Salita Moiariello 16, I-80131 Naples, Italy
2
Jodrell Bank Centre for Astrophysics, Department of Physics and Astronomy, The University of Manchester, Manchester M13 9PL, UK
3
Department of Physics and Astronomy, University of Sheffield, Sheffield S3 7RH, UK
4
Instituto de Astrofísica de Canarias, E-38205 La Laguna, Tenerife, Spain
5
Institute of Space Sciences (ICE, CSIC), Campus UAB, Carrer de Can Magrans s/n, E-08193 Barcelona, Spain
6
Institut d’Estudis Espacials de Catalunya (IEEC), Carrer de Gran Capitá 2-4, E-08034 Barcelona, Spain
7
Institució Catalana de Recerca i Estudis Avançats (ICREA), E-08010 Barcelona, Spain
8
INAF-Osservatorio Astronomico di Brera, Via Bianchi 46, I-23807 Merate, LC, Italy
9
Department of Physics, University of Warwick, Coventry CV4 7AL, UK
10
ASI – Agenzia Spaziale Italiana, Via del Politecnico snc, 00133 Rome, Italy
11
INAF-Osservatorio Astronomico di Roma, Via Frascati 33, I-00040 Monte Porzio Catone, (RM), Italy
⋆ Corresponding author; This email address is being protected from spambots. You need JavaScript enabled to view it.
Received:
31
May
2024
Accepted:
2
September
2024
Abstract
We present the first X-ray observation of the energetic millisecond pulsar binary PSR J1431−4715, performed with XMM-Newton and complemented with fast optical multi-band photometry acquired with the ULTRACAM instrument at ESO-NTT. It is found as a faint X-ray source without a significant orbital modulation. This contrasts with the majority of systems that instead display substantial X-ray orbital variability. The X-ray spectrum is dominated by non-thermal emission and, due to the lack of orbital modulation, does not favour an origin in an intrabinary shock between the pulsar and companion star wind. While thermal emission from the neutron star polar cap cannot be excluded in the soft X-rays, the dominance of synchrotron emission favours an origin in the pulsar magnetosphere that we describe at both X-ray and gamma-ray energies with a synchro-curvature model. The optical multi-colour light curve folded at the 10.8 h orbital period is double-humped and dominated by ellipsoidal effects, but also affected by irradiation. The ULTRACAM light curves are fit with several models encompassing direct heating and a cold spot, or heat redistribution after irradiation either through convection or convection plus diffusion. Despite the inability to constrain the best irradiation models, the fits provide consistent system parameters, giving an orbital inclination of 59 ± 6° and a distance of 3.1 ± 0.3 kpc. The companion is found to be an F-type star, underfilling its Roche lobe (fRL = 73 ± 4%) with a mass of 0.20 ± 0.04 M⊙, confirming the redback status, but hotter than the majority of redbacks. The stellar dayside and nightside temperatures of 7500 K and 7400 K, respectively, indicate a weak irradiation effect on the companion, likely due to its high intrinsic luminosity. Although the pulsar mass cannot be precisely derived, a heavy (1.8−2.2 M⊙) neutron star is favoured.
Key words: binaries: general / stars: neutron / pulsars: general / pulsars: individual: PSR J1431–4715 / pulsars: individual: 4FGL J1431.4–4711
Publisher note: Some images in Figures 4 and 5 contained an inadvertently added diagonal line. These lines were deleted on 07 November 2024.
Deceased.
© The Authors 2024
 Open Access article, published by EDP Sciences, under the terms of the Creative Commons Attribution License (https://creativecommons.org/licenses/by/4.0), which permits unrestricted use, distribution, and reproduction in any medium, provided the original work is properly cited.
This article is published in open access under the Subscribe to Open model. This email address is being protected from spambots. You need JavaScript enabled to view it. to support open access publication.
1. Introduction
Millisecond pulsar (MSP) binaries are compact systems consisting of a fast spinning neutron star (NS) and a low-mass companion star. Those in a tight orbit (Porb ≲ 1 d) are dubbed ‘spiders’ (Roberts 2013) and, depending on the companion mass (Mc), are subdivided into ‘black widows’ (Mc ≲ 0.1 M⊙) and ‘redbacks’ (Mc ∼ 0.1 − 0.4 M⊙). These old NSs in binaries are believed to be spun up to very short spin periods during a previous gigayear-long phase of mass accretion from an evolved companion. According to the recycling scenario (Alpar et al. 1982; Backer et al. 1982) during the accretion phase, MSP binaries were low-mass X-ray binaries (LMXBs) and turned into radio and gamma-ray pulsars when mass accretion ceased. The first observational evidence of transitions from a LMXB to a rotation-powered pulsar state was found in the MSP PSR J1023+0038 (Archibald et al. 2009). However, the subsequent detections of state transitions from and/or to a disc state in other systems – IGR J1825−2452, in the M28 globular cluster (Papitto et al. 2013; Linares et al. 2014), the Galactic field X-ray source XSS J12270−4859 (Bassa et al. 2014; de Martino et al. 2014), and again PSR J1023+0038 (Stappers et al. 2013; Patruno et al. 2014) – imply that transitions between accretion-powered and rotation-powered states can occur on timescales much shorter than secular evolution. This is likely due to changes in the mass transfer rate from the companion star and possibly controlled by the interplay between the pulsar spin-down power and the companion star wind or by its magnetic activity (see review Papitto & de Martino 2022).
In spiders, the interaction of the relativistic pulsar wind with the companion star wind produces an intrabinary shock (IBS), where particles are accelerated, evaporating the late-type star (Arons & Tavani 1993). Depending on the energy of the particles, the IBS cools via inverse Compton or synchrotron radiation. Also, depending on the pulsar spin-down power and companion wind momentum, the IBS assumes different orientations, wrapping around the companion star in black widows or the pulsar in redbacks (Hui et al. 2015; Wadiasingh et al. 2018; Kandel et al. 2019; Sim et al. 2024). X-ray orbital modulations are indeed observed in a number of black widows and redbacks with different orbital phasing, indicating the different IBS geometry (Roberts et al. 2018). Furthermore redbacks are found to be more luminous on average in the X-rays than black widows and isolated MSPs, indicating that a larger fraction of pulsar wind is intercepted at the shock compared to black widows (Lee et al. 2018; Koljonen & Linares 2023).
The late-type companions are generally found to be strongly irradiated in black widows, whilst in redbacks the effect is not always detected (Breton et al. 2013; Romani et al. 2015; Strader et al. 2019). The irradiation pattern in both black widows and redbacks is not always found to be consistent with direct irradiation by the pulsar, sometimes requiring illumination from the IBS as well (Romani & Sanchez 2016), or even additional heating due to magnetic activity of the companion star (Sanchez & Romani 2017).
The number of spiders and candidates of both types has largely increased recently, thanks to several deep radio pulsar searches (e.g. Keith et al. 2010; Han et al. 2021; Padmanabh et al. 2023; Thongmeearkom et al. 2024) and to the gamma-ray Fermi-LAT survey (Abdollahi et al. 2022). The latter, in particular, has allowed for efficient detection of MSP binaries, which are unaffected at high energies by eclipse effects from the intrabinary material (Smith et al. 2023). Redbacks are of particular interest because they include the recently discovered subclass of transitional millisecond pulsar binaries. Among the newly identified redbacks, a number of them still lack multi-band observations to derive the physical parameters of the IBS and the companion star.
In this paper we focus on the poorly studied MSP binary PSR J1431−4715 (henceforth J1431). It was discovered in the High Time Resolution Universe (HTRU) survey by Bates et al. (2015) as one of the fastest (2.01 ms) and most energetic pulsars with a spin-down power  erg s−1. Its pulsed radio emission was found to be affected by strong eclipses at the binary 10.8 h orbital period. The radio orbital solution classified J1431 as a MSP binary with a non-degenerate donor, with a minimum mass of Mc = 0.12 M⊙. J1431 has also recently been detected at high energies by Fermi-LAT and catalogued as 4FGL J1431.4−4711 in the 4FGL-DR3 12-yr and 4FGL-DR4 14-yr LAT catalogues (Abdollahi et al. 2022; Ballet et al. 2023), respectively, with Lγ = 1.26 − 8.11 × 1033 erg s−1 for a distance range of 1.5−3.8 kpc, encompassing distance values derived from the dispersion measure (DM) (Bates et al. 2015; Jennings et al. 2018) and Gaia (Antoniadis 2021; Gaia Collaboration 2023)1. A deep search for pulsations has also identified J1431 as a gamma-ray pulsar at the ∼7σ level (Bruel 2019) and thus it is included in the recent third Fermi-LAT catalogue of gamma-ray pulsars (Smith et al. 2023), joining the sample of 14 confirmed redbacks with radio and gamma-ray detections. Medium time resolution optical photometry and spectroscopy was carried out by Strader et al. (2019) who revealed the orbital motion of the companion star and found it to be affected by mild irradiation. The binary parameters were not constrained due to the degeneracy between the inclination and filling factor.
We present here a multi-band analysis of J1431 consisting of an X-ray observation of J1431 performed with XMM-Newton that has allowed the detection for the first time of the X-ray emission, as well as optical multi-colour fast photometry acquired at ESO La Silla with the ULTRACAM instrument mounted at the NTT telescope. The observations are presented in Sect. 2, the X-ray timing and spectral analysis are reported in Sect. 3.1, and the optical photometric study is provided in Sect. 3.2. We discuss the results in Sect. 4 and compare them with other redback properties.
2. Observations and data reduction
2.1. The XMM-Newton observation
J1431 was observed by XMM-Newton on 2021 Jan. 21 (OBSID: 0860430101) with the EPIC-pn camera (Strüder et al. 2001) in the Large Window imaging mode and with the thin optical blocking filter for an exposure time of 92.3 ks and with the EPIC-MOS1 and MOS2 cameras (Turner et al. 2001) in Partial Window imaging mode with the thin filter for an exposure time of 93.3 and 94.6 ks, respectively. The presence of background flaring activity at the beginning and end of the pointing reduced the effective exposures to 78.9 ks and 84.4 ks for the EPIC-pn and MOS cameras, respectively2. The Optical Monitor (OM) (Mason et al. 2001) was set in fast window mode using the V (5100−5800 Å) and UVW1 (2450−3200 Å) filters. Nine OM science windows of ∼4400 s each were acquired sequentially in the V and UVW1 filters, totalling an exposure of 39.6 ks in each of them, respectively. The log of the observations is reported in Table 1.
Observing log of J1431.
The data were processed and analysed using the XMM-Newton Science Analysis Software (SAS v.20.0) with the latest calibration files. The photon arrival times from EPIC cameras were corrected to the Solar System barycentre using the JPL DE405 ephemeris and the nominal position of J1431 reported by Bates et al. (2015)3. For the EPIC cameras, we extracted events using a 16″ radius circular region centred on the source and using a background region of the same size located on the same CCD chip. To improve the S/N, the data were filtered by selecting pattern pixel events up to double with zero-quality flag for the EPIC-pn data and up to quadruple for the EPIC-MOS data. Background subtracted light curves were produced using the EPICLCCORR task in the whole 0.2−12 keV range and in two bands covering the 0.2−4 keV and 4−12 keV ranges. Given the faintness of the source, the light curves were binned into 1200 s and 2400 s-long intervals, respectively. The EPIC spectra were extracted in the 0.3−10 keV range, filtering the events using good time intervals obtained by selecting low background epochs with the task GTIGEN. Response matrix and ancillary files were generated using the tasks RMFGEN and ARFGEN, respectively. The spectra were rebinned with a minimum of 30 counts in each bin using the SPECGROUP routine before fitting.
The OM V and UVW1 fast window data were processed and background light curves were generated with the task OMFCHAIN with a bin time of 400 s and 1100 s, respectively. Given the small size of the fast window mode, the centring of the target was inspected for each window. Due to a drift of the telescope, the target was found to be partially outside the window of the last V band observation and the first UVW1 band window and therefore these were disregarded. The light curves were then corrected to the Solar System barycentre in the same manner as the EPIC data. The OM V and UVW1 count rates were also converted into AB magnitudes using the count rate magnitude conversion available at the XMM-Newton SOC4.
2.2. The ULTRACAM observations
J1431 was observed with the ESO 3.5m New Technology Telescope (NTT) at La Silla (Chile) equipped with the ULTRACAM photometer (Dhillon et al. 2007) that allows simultaneous high speed three-colour photometry for three consecutive nights from 2019 April 12 to April 14 in relatively good seeing (1−1.5″) conditions.
During the first two nights the Super SDSS us, gs, rs filters were used, while on the third night the photometry was acquired with the us, gs, is filters. The Super SDSS filters are described in Dhillon et al. (2021). Single exposure times were 60.6 s for the us filter and 20.2 s for the gs, rs, is filters. The instrument was set in full-frame and no-clear mode giving a dead time between each frame of 0.024 s with a GPS time stamp of each frame to an absolute accuracy of 1 ms. Due to a rotator flip at transit, the science exposures were stopped for a few minutes. The log of the ULTRACAM observations is reported in Table 1.
The data were reduced using the improved reduction pipeline developed for HIPERCAM (Dhillon et al. 2021). The images were debiased using master bias and dark frames and flat-fielded using a master twilight flat field. Aperture photometry with variable sized object apertures scaled to the seeing in each frame was applied to extract counts. The sky was determined from a clipped mean in an annulus around the object aperture and subtracted. Several comparison stars in the same field of view were also extracted to perform differential photometry. Among the comparison stars two of them have similar colour to J14315, which then have been used to calibrate the target using their magnitudes from the SkyMappper Southern Survey DR2 catalogue (Onken et al. 2019). These have also been checked against variability and we chose the more stable reference star SMSS J143149.5−471538.1 with AB magnitudes u = 17.61 ± 0.03, g = 15.89 ± 0.01, r = 15.50 ± 0.01 and i = 15.261 ± 0.008. The light curves in the different bands were inspected against degradation due to twilight at the end of the observing runs and the affected points were removed from the light curves. Barycentric correction was also applied to the time series in the different filters.
3. Data analysis and results
3.1. The X-ray emission
The XMM-Newton observation finds J1431 as a faint source (Table 1) and thus we restrict to the more sensitive EPIC-pn data for the timing analysis, after inspection of no improvement in the S/N when summing the rates from the three EPIC cameras. In Fig. 1 the EPIC-pn light curve in the total 0.2−12 keV is displayed together with those in the soft 0.2−4 keV and hard 4−12 keV ranges. Although the length of the observation covers twice the 10.8 h binary period, there is no clear orbital modulation in the total band. The soft 0.2−4 keV bands may hint at a possible variability with a marginal increase in the flux at about 28 ks from the start of the observation, not observed in the hard (4−12 keV) range. The hardness ratio HR, defined as the ratio of count rates between the 4−12 keV and 0.2−4 keV bands, may indicate a softening at that time, but also at earlier and later times as depicted in Fig. 1, although at these epochs the hard band count rates are consistent with zero given the uncertainties on the background subtracted rate.
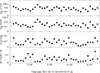 |
Fig. 1. EPIC-pn light curves of J1431. From top to bottom: light curves in the 0.2−12 keV, 0.2−4 keV, and 4−12 keV ranges and the hardness ratio between the hard and soft bands, displayed with a bin size of 2400 s. |
The EPIC-pn energy resolved light curves were also folded at the 10.8 h binary orbital period using the Bates et al. (2015) ephemeris (see left panels of Fig. 2), where phase zero corresponds to the time of the NS ascending node6. The soft band hints to a variability with a semi-amplitude of 14 ± 12% (χν2/d.o.f. = 0.94/9), while a fit with a constant gives χν2/d.o.f. = 0.99/11. The significance of an orbital variability estimated with an F-test is only at 1.6σ confidence level, thus not statistically significant. The light curve in the harder (4−12 keV) range appears to be double-humped with unequal maxima at ϕorb ∼ 0.25 − 0.4 and ∼0.8−1.0. These phases are close but slightly later than the superior and inferior conjunction of the pulsar, respectively. Fitting the hard band orbital light curve with the fundamental and harmonic frequencies, the amplitude is 34 ± 14% (χν2/d.o.f. = 0.60/9), while a fit with a constant gives χν2/d.o.f. = 1.20/11. The significance of the modulation estimated with an F-test is at 4σ confidence level. The hardness ratios indicate a hardening at these two maxima (bottom left panel in Fig. 2).
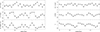 |
Fig. 2. Left: EPIC-pn light curves of J1431 in the 0.2−4 keV (upper panel) and 4−12 keV (middle panel) ranges normalised to their average count rates and the hardness ratio between the two (lower panel) folded at the 10.8 h orbital period evaluated over 12 phase bins. Phase zero corresponds to the time of the ascending node of the pulsar. Right: Folded light curves in the total 0.2−12 keV, UVW1 and V bands normalised to their average count rates. |
On the other hand, the light curve in the total range does not reveal significant orbital modulation (right upper panel in Fig. 2) being consistent with a constant (χν2/d.o.f. = 0.50/11) likely due to the higher count rate in the soft than in the hard band. While a detailed comparison with the optical emission is performed in Sect. 3.2, the simultaneous UV and optical photometry (Fig. 2, right bottom panels) shows a weak double-humped variability with amplitudes of 8 ± 6% in the UVW1 band and 8 ± 3% in the V band with unequal maxima at the ascending and descending nodes of the NS, although an F-test gives significance at 3σ and 2.5σ levels. The different behaviour will be discussed in Sect. 4.
The X-ray 0.3−10 keV spectrum averaged over the whole observation is featureless with no sign of a cut-off. The EPIC-pn and MOS1,2 spectra were analysed using XSPEC package (Arnaud 1996) and fitted together. We first adopt a simple model consisting of an absorbed power law, CONST*TBABS*POWERLAW, where TBABS accounts for the ISM absorption with abundances from Wilms et al. (2000), and CONST accounts for intercalibration among the three instruments. This model gives a reasonable fit (χν2/d.o.f. = 1.01/26), with a power law index  (uncertainties are 90% confidence level on one interesting parameter) and an unconstrained neutral hydrogen column density NH ≤ 8 × 1020 cm−2. This upper limit is roughly consistent with the total ISM hydrogen column density in the direction of the source (NH, ISM = 1.1 × 1021 cm−2HI4PI Collaboration 2016) and the column density from the dispersion measure DM = 59.35 pc cm−3 of Bates et al. (2015), NH, DM = 1.8(6)×1021 cm−2, using the empirical relation of He et al. (2013), as well as with the column density of ∼1.1 × 1021 cm−2, derived from the recent 3D−NH tool of Doroshenko (2024) that combines dust maps and distance to estimate the optical reddening and X-ray absorption adopting the same distance range. Fixing the column density to NH, ISM = 8 × 1020 cm−2 the fit provides similar results (χν2/d.o.f. = 1.08/27) for the power law index α = 1.88 ± 0.19 (see Fig. 3)7. The unabsorbed flux in the 0.3−10 keV range is 2.6 ± 0.3 × 10⁻¹⁴ erg cm−2 s−1. At the distances of 1.53−3.8 kpc the corresponding luminosity is LX = 0.7 − 5.0 × 1031 erg s−1.
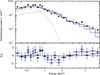 |
Fig. 3. Upper panel: Average 0.3−10 keV spectrum of J1431 (black points). Only the EPIC-pn is shown for clarity, fitted with an absorbed power law (solid blue line) and a composite model (solid black line) consisting of an absorbed power law and a thermal blackbody (dotted black lines) with parameters reported in the text. Lower panel: Residuals of the two fits are shown with blue and black points, respectively. |
Although the simple power law model is formally acceptable, we also included a blackbody component, using BBODYRAD to inspect whether the presence of the thermal emission of the NS is required. We do not attempt to use a NS atmosphere model (e.g. NSA) given the low statistics of the spectra. Keeping fixed the hydrogen column density as before we find a power law index  , a blackbody temperature kTBB = 0.15 ± 0.04 keV and normalisation
  (χν2/d.o.f. = 0.83/25) (see Fig. 3). The latter implies an emitting radius RBB ∼ 100 − 740 m for a distance in the range of 1.53−3.8 kpc. The 0.3−10 keV unabsorbed fluxes of the two components result in:
  erg cm−2 s−1 and
  erg cm−2 s−1. The total luminosity in the 0.3−10 keV range then results LX ∼ 0.9 − 5.55 × 1031 erg s−1 for the above distance range. The inclusion of the blackbody using an F-test is however significant only at a confidence level of 2.5σ.
J1431 displays a similar spectrum to other MSP binaries in the rotation-powered state, with a power law index within the range α = 1.0 − 1.9. The X-ray emission is therefore dominated by synchrotron radiation with a luminosity consistent with that derived in redbacks and higher than those of black widows (see Lee et al. 2018; Yap et al. 2023; Koljonen & Linares 2023). Although not required from the fits, a blackbody component with temperature of ∼0.15 keV and size of a few hundreds of meters is reasonably consistent with those found in MSPs, where the NS thermal emission from the heated pole is detected (Zavlin 2006; Bogdanov et al. 2006, 2011). The ratio of the unabsorbed fluxes between the putative thermal component and the power law in the 0.3−10 keV is ∼0.25 and the bolometric luminosity of the thermal component in the range 2.3 − 15.0 × 1030 erg s−1 are also consistent with those found in MSPs (Zavlin 2006; Bogdanov et al. 2011). Whether the non-thermal emission originates in the IBS or from the pulsar magnetosphere will be discussed in Sect. 4.
3.2. The optical light curves
The ULTRACAM time series clearly show a low-amplitude periodic variability in the us, gs, rs, is bands. Using the longer time coverages in the us, gs, rs filters, the Lomb-Scargle periodograms (Lomb 1976; Scargle 1982) reveal the presence of strong power at the harmonic of the 10.8 h orbital period (see Fig. 4). A sinusoidal fit composed of the fundamental and harmonic to the light curves gives a period PusΩ = 0.45024(22) d, PgsΩ = 0.449499(48) d and PrsΩ = 0.44950(12) d fully consistent with the more precise orbital period of 0.4497391377(7) d derived from radio timing by Bates et al. (2015). The modulation amplitudes in the four bands are AusΩ = 0.0193(8) mag, Aus2Ω = 0.0734(2) mag; AgsΩ = 0.0215(1) mag, Ags2Ω = 0.0682(1) mag, ArsΩ = 0.0153(2) mag, Ars2Ω = 0.0630(1) mag and AisΩ = 0.0117(3) mag, Ais2Ω = 0.0601(2) mag, where for the is band the orbital frequency of Bates et al. (2015) has been adopted.
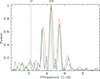 |
Fig. 4. Lomb-Scargle periodogram of the ULTRACAM light curves (solid lines) in us (blue), gs (green), and rs (red) filters displaying the strongest peak at twice the orbital frequency (vertical dashed line). Periodograms of the residuals of the sinusoidal fits in each colour are reported with a dotted line. |
The observed light curves, including the OM UVW1 and V band filters folded at the orbital period using the accurate ephemeris of Bates et al. (2015) are shown in Fig. 5. The double-humped shape clearly demonstrates the presence of ellipsoidal variations due to the tidal distortion of the companion star, which however are not symmetrical and do not show equal minima. These minima occur at ϕorb ∼ 0.25 and 0.75. Also slight phase shifts are observed at the two maxima, one anticipating at ϕorb = 1.0 and the other lagging at ϕorb = 0.5. The wavelength dependent amplitudes also hint at colour effects, likely due to irradiation as pointed out by Strader et al. (2019). It is worth of note the different shape of the V band orbital modulation observed in 2021 with respect to the ULTRACAM light curves acquired in 2019, possibly indicating a change in irradiation efficiency, although the lack of a deeper minimum at ϕorb ∼ 0.25 could also be due to the lower accuracy of the OM photometry. We then limit ourselves to the analysis of the high time resolution ULTRACAM data.
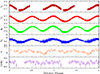 |
Fig. 5. From bottom to top: Observed orbital light curves in the OM UVW1 and V filters acquired in 2021 and in the ULTRACAM us, gs, rs and is filters acquired in 2019. Ordinates are AB magnitudes. |
3.3. Modelling of the optical light curves
The ULTRACAM light curves, complemented with the radial velocity curve obtained from the Hα absorption line by Strader et al. (2019) for the companion star, were analysed with the ICARUS8 binary modelling code (Breton et al. 2012) to constrain system parameters and the temperature profile of the companion. This software is used along with ATLAS9 stellar atmosphere grids (Castelli & Kurucz 2003) to construct a photometric grid of synthetic atmosphere models, which in turn are folded through the ULTRACAM filter transmissions to obtain the observed flux at a given distance. The MULTINEST nested sampling algorithm (Feroz et al. 2019) was used to explore the parameter space, which provides the Bayesian evidence (Z) of a model.
The precise pulsar radio-timing solution derived by Bates et al. (2015) was adopted to fix the input parameters: the time of the ascending node of the pulsar (Tasc = BMJD 55756.1047771), the orbital period (Porb = 0.4497391377 d) and the projected semimajor axis of the pulsar orbit (x = apsr sin i/c = 0.550061 lt-s). The pulsar mass function f(Mpsr) relates to the system parameters as  where q = Mpsr/Mc is the pulsar-to-companion mass ratio, i is the binary inclination. Since the mass function is related to the companion star radial velocity amplitude Kc as
  , the parameters to be fit are i, Kc. The ICARUS code constructs a stellar surface whose radius is parametrised by the Roche lobe filling factor fRL, defined as the ratio between the radius of the companion in the direction of the pulsar and the distance between the companion centre of mass and the inner Lagrangian point (L1). fRL is then another fit parameter. The surface stellar temperature Tbase is defined as the temperature of the pole prior to irradiation and, accounting for gravity darkening, Tbase is multiplied by (g/gpole)β, where g is the acceleration gravity and β is the gravity darkening exponent. This parameter is fixed at β = 0.08 and β = 0.25, which are appropriate for convective and radiative envelopes, respectively (Lucy 1967). The effect of the pulsar heating is represented by the irradiating temperature Tirr, defined such that a flux
  at the star centre of mass is received at a distance a from the pulsar. With the assumption that the irradiating flux is immediately thermalised and re-radiated (Breton et al. 2012), each surface element at a distance r from the pulsar, with its normal vector forming an angle θ with respect the vector pointing to the pulsar, has a temperature such that T4 = [Tbase4
![Mathematical equation: $ (g/g_{\mathrm{pole}})^{4\beta} + T_{\mathrm{irr}}^{4}\,\cos\,\theta\,(a/r)^{2}]^{1/4} $](/articles/aa/full_html/2024/11/aa50955-24/aa50955-24-eq10.gif) . This model assumes direct heating (DH) from the pulsar and applies gravity darkening prior to irradiation, here termed pre-irradiation gravity darkening (pre-IGD) (Breton et al. 2013). Gravity darkening applied after irradiation and heat redistribution on the companion surface, here termed post-irradiation gravity darkening (post-IGD), as done in Romani & Sanchez (2016), Romani et al. (2021) and Dodge et al. (2024), has also been investigated. However the presence of asymmetries and shifts in the light curves of J1431, already noticed by Strader et al. (2019), cannot be accounted for by the simple DH approach. These features can instead be modelled either by adding hot or cold spots or by including heat redistribution within the outer layers of the star by convection only (C) and/or diffusion and convection (D+C) (Kandel & Romani 2020; Voisin et al. 2020). These models have also been inspected by applying both pre-IGD and post-IGD.
. This model assumes direct heating (DH) from the pulsar and applies gravity darkening prior to irradiation, here termed pre-irradiation gravity darkening (pre-IGD) (Breton et al. 2013). Gravity darkening applied after irradiation and heat redistribution on the companion surface, here termed post-irradiation gravity darkening (post-IGD), as done in Romani & Sanchez (2016), Romani et al. (2021) and Dodge et al. (2024), has also been investigated. However the presence of asymmetries and shifts in the light curves of J1431, already noticed by Strader et al. (2019), cannot be accounted for by the simple DH approach. These features can instead be modelled either by adding hot or cold spots or by including heat redistribution within the outer layers of the star by convection only (C) and/or diffusion and convection (D+C) (Kandel & Romani 2020; Voisin et al. 2020). These models have also been inspected by applying both pre-IGD and post-IGD.
The ICARUS code also encodes as fit parameters the optical interstellar reddening defined as E(B − V) in the direction of J1431 determined in each band using dust maps and extinction vectors from Chiang (2023) as well as the source distance d. Hence the fit parameters for all these models are: E(B − V), d, Kc, i, fRL, Tbase, Tirr. For the models accounting for heat redistribution with convection (C) and diffusion plus convection (D+C), additional fit parameters are the convective strength parameter Campl, which determines the profile of the convective wind and the diffusion parameter κdiff, which describes the amplitude of a linear diffusion effect (see Voisin et al. 2020). In the case of spot model a single surface hot or cold spot is added to the DH model with fitted temperature difference Tspot, angular size Rspot, and position angles θspot, ϕspot (see Clark et al. 2021; Stringer et al. 2021).
The main priors for the fit parameters were chosen such that they are physically or geometrically motivated. Among them, the distance of J1431 whose prior is constructed combining the ranges derived by Bates et al. (2015), Jennings et al. (2018), Antoniadis (2021) and Gaia DR3 (see Sect. 1), but allowed to vary from 0.1 to 20 kpc. Also a Gaussian prior is applied to the interstellar extinction E(B − V), centred at 0.166 with standard deviation of 0.16 but allowed to vary over a larger range from 0 to 1. The base and irradiation temperatures were constrained to lie between 2100 K and 12 000 K, and between 2300 K and 15 000 K, respectively. For the binary inclination angle i, a uniform prior in cos i has been adopted. As for the Roche lobe filling factor fRL, a uniform prior has been adopted between 0.2 and 1.0. The spectroscopic Kc constraints are provided by the observed radial velocity curves obtained from cross-correlation of the Hα absorption line in the optical spectrum of J1431 by Strader et al. (2019). Here the ICARUS code simulates spectra at specific orbital phases and the radial velocities of the model are compared to the observed values (see also Dodge et al. 2024).
Among the several model fits, those with post-IGD prescription outperform the pre-IGD in all cases, except identical results are found for the DH+Spot model adopting either pre-IGD or post-IGD heat redistribution prescription. In Table 2 the results of the different modelling are reported for the post-IGD prescription only and for the two values of the gravity darkening exponent β. Models with β = 0.25 have much lower Bayesian evidence (log Z) with respect to those adopting β = 0.08, and hence are discarded. Here we note that the transition temperature from convective to radiative envelopes falls in the range ∼7000 − 7900 K (Rafert & Twigg 1980; Alencar & Vaz 1997), justifying the investigation with both β values. The fitted parameters with β = 0.08 are found to be all consistent within 1σ for those models with higher Bayesian evidence, namely that with convection (C), with diffusion and convection (D+C) and with direct heating (DH) with a cold spot. A slight preference for the DH with a cold spot is found. This model is shown in Fig. 6 where the fitted multi-colour light curves (panel A) are displayed together with the surface temperature map of the companion (panel B) as well as the observed and model radial velocity curves (panel C). Corner plots for the best three models (C), (D+C) and DH+spot with post-IGD are reported in Figs. A.1, A.2 and A.3, respectively. The similarities of the results obtained with these three best fit models provide evidence that the derived parameters are reliably constrained despite the inability of determining whether heat redistribution models or a spotted surface represent the physical state of the companion star.
Posterior parameters obtained from the fits of our multi-colour light curves and radial velocity curve from Strader et al. (2019).
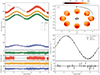 |
Fig. 6. Panel A: ULTRACAM light curves shown with different colours fitted with the DH model and a cold spot overlaid with solid black lines. Residuals are shown in the lower panels. Panel B: Surface temperature map along the orbit. Panel C: Observed radial velocity curve of J1431 obtained by Strader et al. (2019) (black dots) and the ones predicted by the model (empty dots) connected with a solid line together with a sinusoidal fit (dotted line). Residuals are displayed in the lower panel. Here phase zero is the inferior conjunction of the companion star. |
The distance of J1431 has not been well constrained by several methods (Bates et al. 2015; Jennings et al. 2018; Antoniadis 2021; Gaia Collaboration 2023), allowing for a wide range from 1.5 kpc to 3.8 kpc. Here we find consistency for all the three models, which, adopting the higher and lower bounds of the derived parameters, provide a distance to J1431 of 3.1 ± 0.3 kpc, well within the above range and that we adopt in the forthcoming section. The interstellar extinction E(B − V) = 0.17 − 0.19, giving AV = 0.52−0.59 is also consistent with the upper limit to the hydrogen column density found from the X-ray spectral fits (see Sect. 3.1) using the Güver & Özel (2009) relation. The binary system parameters are discussed in Sect. 4.
4. Discussion
4.1. A mildly irradiated companion
The parameters obtained with the ICARUS code for the three best fit models give consistent values within 1σ for the binary inclination, the companion Roche lobe filling factor and mass. By averaging among the three models we obtain i = 59 ± 6°, fRL = 73 ± 4%, Mc = 0.20 ± 0.04 M⊙, which are broadly consistent with the preliminary results obtained by Strader et al. (2019) but more accurate. These values confirm the redback status of J1431.
The companion surface is found to have hemisphere-averaged nightside and dayside temperatures Tnight ∼ 7400 K and Tday ∼ 7500 K, both higher than previously estimated (∼6500−6600 K) by Strader et al. (2019). We here note that this lower temperature estimate is based on spectra covering a narrow spectral range between 5500−6730 Å encompassing only Hα and not a wider wavelength range as our multi-band photometry. We also verified whether the extinction prior could affect the temperature determination adopting a flat prior for the reddening. The posterior distributions of the fit are found similar to those adopting a Gaussian prior, indicating that the reddening does not affect the temperature determination. The spectral type of the companion would then be an early-F star, much hotter than the majority of redbacks, which are instead found in the range of 2800−6300 K (Turchetta et al. 2023), with only PSR J1816+4510 found to be extreme (16 000 K) (Kaplan et al. 2013; Turchetta et al. 2023). The companion of J1431 could be an outlier due to an unusual binary evolution, or hot redback companions are still to be discovered. This shows that the characterisation of the optical companions of newly discovered redbacks is an important aspect of investigation. The irradiating temperature Tirr ∼ 3900 K implies an equivalent irradiation luminosity Lirr = 4 π a2 σ Tirr4 ∼ 7.8 × 1033 erg s−1, where a = 2.17 × 1011 cm having adopted apsr sin i from Bates et al. (2015) and the derived values for the inclination i = 59° and mass ratio q = 10.4. This luminosity when compared to the spin-down power  erg s−1 from Bates et al. (2015) or that derived in Sect. 4.2 below, gives an efficiency
  , not unusual in rebacks, although at the low end of irradiation efficiencies (see Breton et al. 2013; Yap et al. 2023). To estimate the heating effect on the companion we consider the expected heating impinging on the companion in the case of an isotropic pulsar wind
  where fΩ is the geometric factor ∼0.5 (1 − cosθ) with θ = arctan (Rc/a), neglecting albedo. Adopting the derived companion radius Rc = 0.6 R⊙ and the above value for a, fΩ = 0.009 and then Lheat = 6.1 × 1032 erg s−1. The ratio between the expected heating and the companion unheated luminosities, Lc, base = 4πRc2 σ Tbase4 = 4 × 1033 erg s−1, then results in ηheat = Lheat/Lc, base = 0.15. This indicates that the companion luminosity is about 6.5 times larger than the heating, hence implying weak irradiation as indeed evidenced by the observed double-humped light curves, indicating that they are dominated by ellipsoidal effects. The fact that MSP binaries with intrinsic companion luminosities larger or comparable to that expected from pulsar irradiation show negligible heating effects was already pointed out by Hui et al. (2015) and it is further supported by the results by Turchetta et al. (2023) on a larger number of spiders with a wide range of orbital periods. The long orbit of J1431 and hence large separation together with the high companion luminosity can explain the lack of strong irradiation in this system.
4.2. A heavy neutron star
Noteworthy is the derived pulsar mass Mpsr ranging from 1.8 to 2.2 M⊙, considering all three models. Although we are unable to discriminate among the various models employed, which limits the precision to which this parameter is constrained, a massive NS in J1431 is favoured. In the recent years, NS masses in spiders have been subject of several investigations (see Linares 2020; Strader et al. 2019; Clark et al. 2021, and references therein). Comparing the NS mass derived for J1431 with the latest compilations of NS masses in (Kennedy et al. 2022; Rocha et al. 2023; Dodge et al. 2024; Sen et al. 2024), J1431 joins the group of massive NSs, which includes the redbacks PSR J2215+5135, PSR J1622−0315 and PSR J1816+4510 and the black widows PSR J1653−0158, PSR J1810+1744, PSR J0952−0607 and PSR JB1957+20. Noteworthy is the case of PSR J1622−0315, a mild irradiated redback potentially hosting a massive NS (Sen et al. 2024). These systems are particularly attractive because they allow lower limits be set on the maximum NS mass and hence have important implications for the dense matter equation of state (EoS).
The spin-down power of the pulsar, defined as  , where P and Ṗ are the spin period and its derivative and I = 2/5 MNS RNS2 is the momentum of inertia of the NS, was estimated by Bates et al. (2015) as
  erg s−1, adopting the canonical NS moment of inertia I = 1045 g cm2 and correcting the spin period derivative for the Shklovskii effect. The proper motion of J1431 is now better constrained by Gaia DR3 (Gaia Collaboration 2023) μ = 18.7(2) mas yr−1, which allows a more accurate determination of the Shklovskii effect. We then correct the observed spin period derivative Ṗ for this effect:
  , where vt is the transverse velocity, and d the distance. Adopting d = 3.1 ± 0.3 kpc, we derive
  s s−1, where Pobs = 1.411 × 10⁻²⁰ s s−1 is the observed spin period derivative by Bates et al. (2015). Given the evidence of a higher NS mass than 1.4 M⊙ (see Table 2), we adopt conservatively the lower limit of Mpsr = 1.8 M⊙ and, lacking knowledge of EoS, a NS radius of 10 km (see also Steiner et al. 2013; Han & Prakash 2020; Riley et al. 2021), giving
  erg s−1, slightly lower than the previous determination. It is not too far from the value of 5.2 ± 0.3 × 1034 erg s−1 derived by Koljonen & Linares (2023) adopting the canonical moment of inertia I = 1045 g cm2 and the lower Gaia distance of ∼1.6−2.6 kpc. Further observations, such as optical spectroscopy, would be desirable to better investigate the irradiation model and hence constrain the NS mass.
4.3. An X-ray dim redback
Our first deep X-ray observation of J1431 has detected a faint X-ray source without significant variability at its orbital period. The X-ray emission in the soft (0.2−4 keV) is unmodulated and in the hard (4−12 keV) range only a hint at 4σ level of a double peaked variability is found. This contrasts with the majority of spiders displaying substantial X-ray orbital variations, which are often found double-peaked due to Doppler boosting of the IBS synchrotron emission. In redbacks the non-thermal emission is Doppler boosted at inferior conjunction of the NS and de-boosted at superior conjunction. The separation of the two peaks and their intensity strongly depends on the bulk Lorentz factor, viewing angle and shock radii (Wadiasingh et al. 2017). In black widows the maximum of X-rays occurs at superior conjunction of the NS, while in the majority of rebacks it is the opposite (Roberts et al. 2018). This has been interpreted as different geometry of the IBS, which wraps the pulsar in redbacks or the companion in black widows, respectively, depending to the momentum ratio between the companion and the pulsar winds (Romani & Sanchez 2016; Wadiasingh et al. 2017).
In J1431 the companion is found to be luminous, suggesting a higher wind momentum and it is conceivable that the IBS wraps the pulsar as the majority of redbacks. In this case an orbital modulation is expected and affected by Doppler boosting at inferior conjunction of the NS. The lack of an orbital modulation in J1431 could arise if the system is viewed at low inclination angles. However the optical analysis reveals an intermediate binary inclination of ∼60°. A low inclination is also not favoured by the presence of long radio eclipses at superior conjunction of the pulsar, lasting ∼0.3 in orbital phase (Bates et al. 2015). However, the possibility that an IB shock dominates the X-ray emission in J1431, not producing an X-ray orbital modulation cannot be discarded, but determining the properties of the IB shock is not an easy task given the dependence on the binary inclination, the shock location, opening angle and bulk velocity (β = v/c) of accelerated particles. In the thin-shell approximation (Canto et al. 1996), generally adopted for spiders, for a moderate inclination angle, shadowing of the companion is not expected to produce significant obscuration of the shock emission if the shock is located close to the pulsar and if most of the emission originates close to the shock nose and the opening angle is small. Near the shock nose, the bulk velocity is low and Doppler-boosting is not efficient (Wadiasingh et al. 2017). Given the lack of higher energy coverage above 10 keV that would allow the inspection of a spectral break to estimate the shock location as well as the lack of coverage of the radio eclipses at low frequencies (Bates et al. 2015) to derive the maximum shock opening angle, it is not possible to verify this hypothesis.
Adopting the derived distance d = 3.1 ± 0.3 kpc, the X-ray luminosity ranges between 1.4 − 2.1 × 1031 erg s−1 in the 2−10 keV band, or between 2.1 − 3.0 × 1031 erg s−1 in the 0.5−10 keV range. When compared the X-ray luminosity to those observed in spiders, J1431 is located between the redbacks and black widows and in particular among low X-ray luminosity redbacks (Lee et al. 2018; Yap et al. 2023; Koljonen & Linares 2023). The efficiency in converting spin-down power to X-ray luminosity in J1431 is  (2−10 keV) or 0.03−0.05% (0.5−10 keV). Although caution should be taken adopting empirical relations, this luminosity ratio locates J1431 in between the so-called “inefficient” and “efficient” IBS tracks derived by Koljonen & Linares (2023). All this indicates a very weak contribution of the IBS, if any.
Noteworthy, J1431 not only joins the low X-ray luminosity redbacks but also shares with these systems a double-humped optical light curve, dominated by ellipsoidal variability. Hence, it is very likely that the weak companion heating is not due to X-ray irradiation. Indeed our time-resolved X-ray light curve does not allow us to conclude whether the non-thermal emission originates in an IBS.
The spectral analysis indicates that the emission is dominated by non-thermal radiation, described with a power-law model with index 1.3−1.9, similar to those observed in spider pulsars (Lee et al. 2018; Koljonen & Linares 2023). Although formally not required by the spectral fits, a thermal component at kTBB ∼ 0.15 keV originating at the heated NS polar cap (RBB ∼ 180 − 660 m for the distance range 2.8−3.4 kpc derived in Sect. 3.3) could be also present. Similar values for this thermal component are found in other spiders (Zavlin 2006; Bogdanov et al. 2006, 2011), contributing ∼20% to the total X-ray flux. Hence, it is also possible that the dominant X-ray non-thermal emission originates in the NS magnetosphere. In this case the X-ray emission would be pulsed at the spin period of the NS, but the X-ray data were acquired in imaging mode with a temporal resolution of 47.7 ms, preventing any search of spin pulses. Worth of note is that searches for X-ray spin pulsations in the rotation-powered state of the transitional MSP XSS J12270−4859 led negative detection even using high time resolution data (Papitto et al. 2015).
The gamma-ray emission of J1431 is typical of pulsars with a spectral shape modelled with a power law with a superexponential cutoff (Ballet et al. 2023; Smith et al. 2023) giving a 100 MeV–100 GeV flux of 4.7 × 10⁻¹² erg cm−2 s−1 and a gamma-ray luminosity for a distance range of 2.8−3.4 kpc Lγ = 4.4 − 6.5 × 1033 erg s−1.
The ratio of gamma-ray luminosity to spin-down power  indicates an efficiency of conversion consistent with the median of 10% of redbacks (Strader et al. 2019). The gamma-ray emission in pulsar binaries is generally dominated by the pulsar magnetospheric radiation and should not be modulated at the orbital period for moderately low binary inclinations. However if gamma-rays are also produced in an IBS an orbital modulation should be observed such as in the bright systems XSS J12270−4853, PSR J2339−0533 and PSR J2039−5617 (Clark et al. 2021; Sim et al. 2024), in which also the X-rays are strongly modulated at the orbital period (Roberts et al. 2018; de Martino et al. 2015, 2020). In J1431 there is no firm evidence of variability in the X-rays and searches in the gamma-rays do not provide evidence of either an orbital modulation or eclipses (Clark et al. 2023). The X-ray (0.5−10 keV) to gamma-ray flux ratio FX/Fγ ∼ 0.5% is lower than that found in most redbacks and similar to PSR J1908+2105 (∼0.6%), surpassing only PSR J1622−0315 (∼0.3%) and PSR J1816+4510 (∼0.05%) (Strader et al. 2019). It is then plausible that the gamma-ray emission in J1431 originates in the pulsar wind.
We constructed the broad band X-ray and gamma-ray spectral energy distribution (SED) using our X-ray spectral analysis adopting the composite blackbody and power law model and the Fermi-LAT SED as retrieved from the recent third pulsar catalogue (Smith et al. 2023) along with the typical pulsar superexponential cutoff power law model PLEC4 with peak energy Ep = 0.44 ± 0.24 GeV, spectral slope Γ = 2.63 ± 0.16 spectral curvature d = 0.8 ± 0.3 and superexponential index fixed at the canonical value b = 2/3 due to the source faintness (see details in Smith et al. 2023). The SED (Fig. 7) shows that the X-ray spectrum, when extrapolated to higher energies, is higher than that predicted by the PLEC4 model that, however, cannot be reliably evaluated at lower energies due to the fixed b parameter at the canonical value.
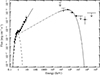 |
Fig. 7. Observed high energy X-ray and gamma-ray SED overlaid with the X-ray composite blackbody plus power law model and the superexponential cutoff model from the third Fermi-LAT pulsar catalogue (Smith et al. 2023). Dashed lines represent the single components of the X-ray model and dotted-dashed line is the extrapolation of the PLEC4 gamma-ray model. |
We then explored whether a significant part of the gamma-ray and X-ray emission could be the direct result of the pulsar magnetospheric emission. Curvature and synchrotron emission from accelerated particles in the magnetospheric gaps or reconnection in the current sheet producing synchrotron radiation at high energies are possible mechanisms at the origin of non-thermal pulses. The synchro-curvature emission model developed by Torres (2018) to describe the high energy spectra of pulsars is based on the assumption that near the light cylinder of a pulsar with determined spin period and period derivative there is a gap with a significant component of the electric field parallel to the magnetic lines and this field accelerates particles. The model follows the particle time evolution, solving the equation of motion and balancing acceleration and losses. It has been successfully applied to the high energy spectra of gamma-ray and X-rays detected pulsars (Torres et al. 2019) and has been further updated with improved treatment of particle injection to generate synthetic spectra and gamma-ray light curves of pulsars (Íñiguez-Pascual et al. 2022, 2024). We hence attempt to describe the observed broad-band SED of J1431 with the updated version of the synchro-curvature model. This allows us to compare the results with those obtained for other gamma-ray pulsars detected. It also has the advantage that it is a rather austere spectral model having only three main physical parameters and a normalisation, which has proven useful to represent X-ray and gamma-ray spectra of pulsars, the appearance of sub-exponential cutoffs at high energies, or the flattening of the X-ray spectra at soft energies. The parameters of the model are the electric field parallel to the magnetic field lines, E||, assumed constant throughout an accelerating region; the magnetic gradient b, such that the local magnetic field B = Bs(x/Rs)−b, where Bs is the surface polar magnetic field estimated from radio timing (∼2 × 10⁸ G) and Rs is the NS radius; and the spatial extent x0/Rlc9 of the emitting region for particles injected in a given injection point xin. The parameter x0/Rlc plays the role of a weighting function representing the reduction of the number of emitting particles directed towards the observer at a distance from their injection point. The model solves the equation of motion of the particles to obtain their trajectories, and computes the emission of particles along each point. The latter is dependent on the local kinetic properties, such as the Lorentz factor, the pitch angle and position, and the local properties of the magnetic field (see details in Íñiguez-Pascual et al. 2022).
Fig. 8 (left panel) shows the results of the model with log E|| = 9.31 ± 0.04 V m−1, log (x0/Rlc) = − 2.34 ± 0.04 and b = 1.24 ± 0.23 (χν2/d.o.f. = 2.29/23). The fit is not perfect, but reasonably close to the data. The X-ray emission is the worse described by the model, and, related to that, the magnetic gradient is low in comparison with other fitted pulsars (Íñiguez-Pascual et al. 2022, 2024). This can come as a result of two related effects. First, the X-ray spectrum is steeply rising at soft energies, more than usually found for other pulsars, and as a result the peak in X-rays is comparable to the peak in gamma-rays, so that the model is trying to keep up with a large synchrotron emission. Second, this may also come as an effect of considering a more extended region. Farther from the pulsar, the magnetic field still needs to be high – decay more slowly – in order for synchrotron emission to proceed. In addition, the possible NS thermal contamination would mostly affect at these low energies.
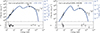 |
Fig. 8. Left: X-ray and gamma-ray SED (black points) displayed together with the synchro-curvature model fit (solid blue line) using the three parameters described in the text. The residuals of the model with respect to the data are shown in the lower panel. Right: The same SED but fitted above 2 keV to avoid possible contamination of thermal emission from the NS. In both panels, the ordinates are expressed in erg s−1 for a distance of 3.1 kpc (left) and in erg cm−2 s−1 (right). |
Given such possibility, the SED has also been fit excluding the soft X-ray portion of the spectrum, and hence below 2 keV. Fig. 8 (right panel) shows the results with log E|| = 9.56 ± 0.04 V m−1, log (x0/Rlc) = − 2.59 ± 0.04 and b = 0.99 ± 0.23 (χν2/d.o.f. = 0.72/7), which describe much better the observed SED. The higher value of the parallel electric field and the lower b are the consequence of the steep X-ray slope. Since there are not many MSPs with both X-ray and gamma-ray data (see Íñiguez-Pascual et al. 2022), it is not possible to state whether this steep spectrum is a common or unusual property of MSPs. In summary, a magnetospheric origin for the X-ray to gamma-ray emission seems to be plausible.
5. Conclusions
We have analysed for the first time the X-ray and optical emission of the energetic MSP pulsar binary J1431 to assess the system parameters and characterise its multi-band emission. Here we summarise the main results:
-
Our first deep X-ray observation of J1431 has detected a dim X-ray source without significant variability at its 10.8 h orbital period. This contrasts with the majority of spiders displaying substantial X-ray orbital variations, which are often found double-peaked due to Doppler boosting of the IBS synchrotron emission.
-
The X-ray spectrum is featureless and consistent with non-thermal emission with a power law photon index
 and negligible absorption (Nh ≤ 8 × 1020 cm−2). While not statistically significant, the presence of a thermal component (kTBB = 0.15 ± 0.04 keV) may hint at the contribution of the heated polar cap (RBB ∼ 180 − 660 m) in the soft X-rays together with a harder (Γ = 1.3 ± 0.4) power law component dominating at higher energies.
 -
Given that the X-ray timing and spectral analyses do not strongly favour a dominant contribution from an IBS, we inspected whether a magnetospheric origin from the MSP can describe the X-ray and gamma-ray SED and found a reasonable match. This suggests that an IBS in this system, if present, has a negligible contribution.
-
The companion star is found to be an early F-type star with a mass of 0.20 ± 0.04 M⊙ which underfils its Roche lobe (fRL = 73 ± 4%), confirming the redback nature of J1431, although hotter than the majority of redbacks. The multi-colour optical light curves display typical ellipsoidal modulation at the long orbital period but are also affected by irradiation. Among the several models attempted to fit the multi-colour light curves and radial velocity curve, similar parameters are found with a model that includes direct heating from the pulsar and a cold spot with respect to the base stellar temperature (ΔT ∼ −500 K), as well as with models that include heat redistribution after irradiation encompassing convection and also both diffusion and convection. The resulting temperatures of the dayside and nightside faces of the companion are found to be ∼7500 K and 7400 K, respectively, indicating a mild irradiation temperature Tirr ∼ 3900 K. The lack of a strong irradiation is likely due to the high luminosity of the star which is about 6.5 times larger than that expected from heating at the orbital distance from the pulsar.
-
The binary inclination is found to be i = 59 ± 6°, explaining the lack of orbital modulation in the X-rays and gamma-ray regimes. Furthermore, a distance of 3.1 ± 0.3 kpc is found, which locates J1431 at larger distance than previously estimated.
-
Despite the inability to derive the best irradiation model, which limits the precision to which the NS mass is constrained, a massive (1.8 − 2.2 M⊙) NS in J1431 is favoured.
The Gaia DR3 geometric distance ranges between 1.61−2.58 kpc.
The filtering of the event files was performed creating good time intervals (GTIs) by setting a cut in the background rate time series without source contributions.
The radio position is fully consistent with the Gaia DR3 position (Gaia Collaboration 2023).
The comparison stars colours were checked against Gaia DR3.
The radio solution is highly accurate (dϕ/ϕ = 1.15 × 10⁻¹⁰) allowing the folding of the XMM-Newton data.
The results do not change adopting a column density of 1.0 × 1021 cm−2.
Rlc = c/Ω = 96 km is the radius of the light cylinder of the pulsar in J1431.
Acknowledgments
This work is based on observations obtained with XMM-Newton, am ESA science mission with instruments and contributions directly funded by ESA Member States and NASA and on observations collected at the European Southern Observatory under ESO programme 0103.D-0241. This work has made use of data from SkyMapper, a facility funded through ARC LIEF grant LE130100104 from the Australian Research Council, awarded to the University of Sydney, the Australian National University, Swinburne University of Technology, the University of Queensland, the University of Western Australia, the University of Melbourne, Curtin University of Technology, Monash University and the Australian Astronomical Observatory. SkyMapper is owned and operated by The Australian National University’s Research School of Astronomy and Astrophysics. This work has also made use of data from the European Space Agency (ESA) mission Gaia (https://www.cosmos.esa.int/gaia), processed by the Gaia Data Processing and Analysis Consortium (DPAC, https://www.cosmos.esa.int/web/gaia/dpac/consortium). Funding for the DPAC has been provided by national institutions, in particular the institutions participating in the Gaia Multilateral Agreement. The XMM-Newton data are publicly available at the European Space Agency (ESA) archive http://nxsa.esac.esa.int/nxsa-web. The ULTRACAM data can be obtained by contacting the corresponding author or the ULTRACAM team (V.S. Dhillon). DdM, AP, FCZ, AMZ acknowledge financial support from the Italian Institute for Astrophysics (INAF) Research Grant 2022:“FANS”. AP is supported by the Italian Ministry of University and Research (MUR), PRIN 2020 (prot.2020BRP57Z) “Gravitational and Electromagnetic-wave Sources in the Universe with current and next generation detectors (GEMS)”. FCZ is supported by a Ramón y Cajal fellowship (grant agreement RYC2021-03088-I). VSD and ULTRACAM operations are funded by the Science and Technology Facilities Council (grant ST/Z000033/1). RPB acknowledges support from the European Research Council (ERC) under the European Union’s Horizon 2020 research and innovation program (grant agreement N.715051; Spiders). We also acknowledge the support of the PHAROS COST Action (CA 16214). We acknowledge useful comments from the anonymous referee.
References
- Abdollahi, S., Acero, F., Baldini, L., et al. 2022, ApJS, 260, 53 [NASA ADS] [CrossRef] [Google Scholar]
- Alencar, S. H. P., & Vaz, L. P. R. 1997, A&A, 326, 257 [NASA ADS] [Google Scholar]
- Alpar, M. A., Cheng, A. F., Ruderman, M. A., & Shaham, J. 1982, Nature, 300, 728 [NASA ADS] [CrossRef] [Google Scholar]
- Antoniadis, J. 2021, MNRAS, 501, 1116 [Google Scholar]
- Archibald, A. M., Stairs, I. H., Ransom, S. M., et al. 2009, Science, 324, 1411 [Google Scholar]
- Arnaud, K. A. 1996, ASP Conf. Ser., 101, 17 [Google Scholar]
- Arons, J., & Tavani, M. 1993, ApJ, 403, 249 [NASA ADS] [CrossRef] [Google Scholar]
- Backer, D. C., Kulkarni, S. R., Heiles, C., Davis, M. M., & Goss, W. M. 1982, Nature, 300, 615 [NASA ADS] [CrossRef] [Google Scholar]
- Ballet, J., Bruel, P., Burnett, T. H., Lott, B., & The Fermi-LAT Collaboration 2023, ArXiv e-prints [arXiv:2307.12546] [Google Scholar]
- Bassa, C. G., Patruno, A., Hessels, J. W. T., et al. 2014, MNRAS, 441, 1825 [Google Scholar]
- Bates, S. D., Thornton, D., Bailes, M., et al. 2015, MNRAS, 446, 4019 [NASA ADS] [CrossRef] [Google Scholar]
- Bogdanov, S., Grindlay, J., Heinke, C., et al. 2006, ApJ, 646, 646 [NASA ADS] [Google Scholar]
- Bogdanov, S., Archibald, A., Hessels, J., et al. 2011, ApJ, 742, 742 [NASA ADS] [Google Scholar]
- Breton, R. P., Rappaport, S. A., van Kerkwijk, M. H., & Carter, J. A. 2012, ApJ, 748, 115 [NASA ADS] [CrossRef] [Google Scholar]
- Breton, R., van Kerkwijk, M., Roberts, M., et al. 2013, ApJ, 769, 108 [NASA ADS] [CrossRef] [Google Scholar]
- Bruel, P. 2019, A&A, 622, A108 [NASA ADS] [CrossRef] [EDP Sciences] [Google Scholar]
- Canto, J., Raga, A. C., & Wilkin, F. P. 1996, ApJ, 469, 729 [Google Scholar]
- Castelli, F., & Kurucz, R. L. 2003, IAU Symp., 210, A20 [Google Scholar]
- Chiang, Y.-K. 2023, ApJ, 958, 118 [NASA ADS] [CrossRef] [Google Scholar]
- Clark, C. J., Nieder, L., Voisin, G., et al. 2021, MNRAS, 502, 915 [NASA ADS] [CrossRef] [Google Scholar]
- Clark, C. J., Kerr, M., Barr, E. D., et al. 2023, Nat. Astron., 7, 451 [NASA ADS] [CrossRef] [Google Scholar]
- de Martino, D., Casares, J., Mason, E., et al. 2014, MNRAS, 444, 3004 [Google Scholar]
- de Martino, D., Papitto, A., Belloni, T., et al. 2015, MNRAS, 454, 2190 [NASA ADS] [CrossRef] [Google Scholar]
- de Martino, D., Papitto, A., Burgay, M., et al. 2020, MNRAS, 492, 5607 [Google Scholar]
- Dhillon, V. S., Marsh, T. R., Stevenson, M. J., et al. 2007, MNRAS, 378, 825 [NASA ADS] [CrossRef] [Google Scholar]
- Dhillon, V. S., Bezawada, N., Black, M., et al. 2021, MNRAS, 507, 350 [NASA ADS] [CrossRef] [Google Scholar]
- Dodge, O. G., Breton, R. P., Clark, C. J., et al. 2024, MNRAS, 528, 4337 [NASA ADS] [CrossRef] [Google Scholar]
- Doroshenko, V. 2024, A&A, submitted [arXiv:2403.03127] [Google Scholar]
- Feroz, F., Hobson, M. P., Cameron, E., & Pettitt, A. N. 2019, Open J. Astrophys., 2, 10 [Google Scholar]
- Gaia Collaboration (Vallenari, A., et al.) 2023, A&A, 674, A1 [NASA ADS] [CrossRef] [EDP Sciences] [Google Scholar]
- Güver, T., & Özel, F. 2009, MNRAS, 400, 2050 [Google Scholar]
- Han, S., & Prakash, M. 2020, ApJ, 899, 164 [NASA ADS] [CrossRef] [Google Scholar]
- Han, J. L., Wang, C., Wang, P. F., Wang, T., & Zhou, D. J. 2021, RAA, 21, 107 [Google Scholar]
- He, C., Ng, C. Y., & Kaspi, V. M. 2013, ApJ, 768, 64 [NASA ADS] [CrossRef] [Google Scholar]
- HI4PI Collaboration (Ben Bekhti, N., et al.) 2016, A&A, 594, A116 [NASA ADS] [CrossRef] [EDP Sciences] [Google Scholar]
- Hui, C. Y., Hu, C. P., Park, S. M., et al. 2015, ApJ, 801, L27 [NASA ADS] [CrossRef] [Google Scholar]
- Íñiguez-Pascual, D., Viganò, D., & Torres, D. F. 2022, MNRAS, 516, 2475 [CrossRef] [Google Scholar]
- Íñiguez-Pascual, D., Torres, D. F., & Viganò, D. 2024, MNRAS, 530, 1550 [CrossRef] [Google Scholar]
- Jennings, R. J., Kaplan, D. L., Chatterjee, S., Cordes, J. M., & Deller, A. T. 2018, ApJ, 864, 26 [NASA ADS] [CrossRef] [Google Scholar]
- Kandel, D., & Romani, R. W. 2020, ApJ, 892, 101 [NASA ADS] [CrossRef] [Google Scholar]
- Kandel, D., Romani, R. W., & An, H. 2019, ApJ, 879, 73 [NASA ADS] [CrossRef] [Google Scholar]
- Kaplan, D. L., Bhalerao, V. B., van Kerkwijk, M. H., et al. 2013, ApJ, 765, 158 [NASA ADS] [CrossRef] [Google Scholar]
- Keith, M. J., Jameson, A., van Straten, W., et al. 2010, MNRAS, 409, 619 [Google Scholar]
- Kennedy, M. R., Breton, R. P., Clark, C. J., et al. 2022, MNRAS, 512, 3001 [NASA ADS] [CrossRef] [Google Scholar]
- Koljonen, K. I. I., & Linares, M. 2023, MNRAS, 525, 3963 [NASA ADS] [CrossRef] [Google Scholar]
- Lee, J., Hui, C. Y., Takata, J., et al. 2018, ApJ, 864, 23 [NASA ADS] [CrossRef] [Google Scholar]
- Linares, M. 2020, Multifrequency Behaviour of High Energy Cosmic Sources – XIII, 3–8 June 2019, Palermo, 23 [Google Scholar]
- Linares, M., Bahramian, A., Heinke, C., et al. 2014, MNRAS, 438, 251 [NASA ADS] [CrossRef] [Google Scholar]
- Lomb, N. R. 1976, Ap&SS, 39, 447 [Google Scholar]
- Lucy, L. B. 1967, Z. Astrophys., 65, 89 [Google Scholar]
- Mason, K. O., Breeveld, A., Much, R., et al. 2001, A&A, 365, 365 [Google Scholar]
- Onken, C. A., Wolf, C., Bessell, M. S., et al. 2019, PASA, 36, e033 [Google Scholar]
- Padmanabh, P. V., Barr, E. D., Sridhar, S. S., et al. 2023, MNRAS, 524, 1291 [NASA ADS] [CrossRef] [Google Scholar]
- Papitto, A., & de Martino, D. 2022, Astrophys. Space Sci. Lib., 465, 157 [NASA ADS] [CrossRef] [Google Scholar]
- Papitto, A., Ferrigno, C., Bozzo, E., et al. 2013, Nature, 501, 517 [NASA ADS] [CrossRef] [Google Scholar]
- Papitto, A., de Martino, D., Belloni, T. M., et al. 2015, MNRAS, 449, L26 [NASA ADS] [CrossRef] [Google Scholar]
- Patruno, A., Archibald, A. M., Hessels, J. W. T., et al. 2014, ApJ, 781, L3 [Google Scholar]
- Rafert, J. B., & Twigg, L. W. 1980, MNRAS, 193, 79 [Google Scholar]
- Riley, T. E., Watts, A. L., Ray, P. S., et al. 2021, ApJ, 918, L27 [CrossRef] [Google Scholar]
- Roberts, M. 2013, IAU Symp., 291, 127 [NASA ADS] [Google Scholar]
- Roberts, M. S. E., Al Noori, H., Torres, R. A., et al. 2018, IAU Symp., 337, 43 [NASA ADS] [Google Scholar]
- Rocha, L. S., Horvath, J. E., de Sá, L. M., et al. 2023, Universe, 10, 3 [NASA ADS] [CrossRef] [Google Scholar]
- Romani, R. W., & Sanchez, N. 2016, ApJ, 828, 7 [Google Scholar]
- Romani, R. W., Graham, M. L., Filippenko, A. V., & Kerr, M. 2015, ApJ, 809, L10 [NASA ADS] [CrossRef] [Google Scholar]
- Romani, R. W., Kandel, D., Filippenko, A. V., Brink, T. G., & Zheng, W. 2021, ApJ, 908, L46 [NASA ADS] [CrossRef] [Google Scholar]
- Sanchez, N., & Romani, R. W. 2017, ApJ, 845, 42 [Google Scholar]
- Scargle, J. D. 1982, ApJ, 263, 835 [Google Scholar]
- Sen, B., Linares, M., Kennedy, M. R., et al. 2024, ApJ, 973, 121 [NASA ADS] [CrossRef] [Google Scholar]
- Sim, M., An, H., & Wadiasingh, Z. 2024, ApJ, 964, 109 [NASA ADS] [CrossRef] [Google Scholar]
- Smith, D. A., Abdollahi, S., Ajello, M., et al. 2023, ApJ, 958, 191 [NASA ADS] [CrossRef] [Google Scholar]
- Stappers, B., Archibald, A., Bassa, C., et al. 2013, ATel, 5513, 1 [NASA ADS] [Google Scholar]
- Steiner, A. W., Lattimer, J. M., & Brown, E. F. 2013, ApJ, 765, L5 [Google Scholar]
- Strader, J., Swihart, S., Chomiuk, L., et al. 2019, ApJ, 872, 42 [Google Scholar]
- Stringer, J. G., Breton, R. P., Clark, C. J., et al. 2021, MNRAS, 507, 2174 [NASA ADS] [CrossRef] [Google Scholar]
- Strüder, L., Briel, U., Dennerl, K., et al. 2001, A&A, 365, L18 [Google Scholar]
- Thongmeearkom, T., Clark, C. J., Breton, R. P., et al. 2024, MNRAS, 530, 4676 [CrossRef] [Google Scholar]
- Torres, D. F. 2018, Nat. Astron., 2, 247 [NASA ADS] [CrossRef] [Google Scholar]
- Torres, D. F., Viganò, D., Coti Zelati, F., & Li, J. 2019, MNRAS, 489, 5494 [NASA ADS] [CrossRef] [Google Scholar]
- Turchetta, M., Linares, M., Koljonen, K., & Sen, B. 2023, MNRAS, 525, 2565 [CrossRef] [Google Scholar]
- Turner, M. J. L., Abbey, A., Arnaud, M., et al. 2001, A&A, 365, L27 [CrossRef] [EDP Sciences] [Google Scholar]
- Voisin, G., Kennedy, M. R., Breton, R. P., Clark, C. J., & Mata-Sánchez, D. 2020, MNRAS, 499, 1758 [NASA ADS] [CrossRef] [Google Scholar]
- Wadiasingh, Z., Harding, A. K., Venter, C., Böttcher, M., & Baring, M. G. 2017, ApJ, 839, 80 [NASA ADS] [CrossRef] [Google Scholar]
- Wadiasingh, Z., Venter, C., Harding, A. K., Böttcher, M., & Kilian, P. 2018, ApJ, 869, 120 [Google Scholar]
- Wilms, J., Allen, A., & McCray, R. 2000, ApJ, 542, 914 [Google Scholar]
- Yap, Y. X. J., Kong, A. K. H., & Li, K.-L. 2023, ApJ, 955, 21 [NASA ADS] [CrossRef] [Google Scholar]
- Zavlin, V. E. 2006, ApJ, 638, 951 [NASA ADS] [CrossRef] [Google Scholar]
Appendix A: Corner plots for the three best fit models with post-IGD
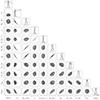 |
Fig. A.1. Corner plot displaying the fitted and derived parameters for the convection (C) model with post-irradiation gravity darkening (post-IGD). Contours are the 68%, 95% and 99.7% confidence levels. The plots along the diagonal are the posterior distributions of the parameters and the solid lines overlaid are the prior distrbutions. The vertical dashed lines represent the 0.025, 0.5 and 0.975 quantiles. |
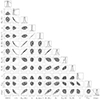 |
Fig. A.2. Corner plot displaying the fitted and derived parameters for the diffuse plus convection (D+C) model with post-irradiation gravity darkening (post-IGD). Contours are the 68%, 95% and 99.7% confidence levels. The plots along the diagonal are the posterior distributions of the parameters and the solid lines overlaid are the prior distrbutions. The vertical dashed lines represent the 0.025, 0.5 and 0.975 quantiles. |
 |
Fig. A.3. Corner plot displaying the fitted and derived parameters for the direct heating (DH) model with a cold spot and with post-irradiation gravity darkening (post-IGD). Contours are the 68%, 95% and 99.7% confidence levels. The plots along the diagonal are the posterior distributions of the parameters and the solid lines overlaid are the prior distrbutions. The vertical dashed lines represent the 0.025, 0.5 and 0.975 quantiles. |
All Tables
Posterior parameters obtained from the fits of our multi-colour light curves and radial velocity curve from Strader et al. (2019).
All Figures
|
Fig. 1. EPIC-pn light curves of J1431. From top to bottom: light curves in the 0.2−12 keV, 0.2−4 keV, and 4−12 keV ranges and the hardness ratio between the hard and soft bands, displayed with a bin size of 2400 s. |
| In the text | |
|
Fig. 2. Left: EPIC-pn light curves of J1431 in the 0.2−4 keV (upper panel) and 4−12 keV (middle panel) ranges normalised to their average count rates and the hardness ratio between the two (lower panel) folded at the 10.8 h orbital period evaluated over 12 phase bins. Phase zero corresponds to the time of the ascending node of the pulsar. Right: Folded light curves in the total 0.2−12 keV, UVW1 and V bands normalised to their average count rates. |
| In the text | |
|
Fig. 3. Upper panel: Average 0.3−10 keV spectrum of J1431 (black points). Only the EPIC-pn is shown for clarity, fitted with an absorbed power law (solid blue line) and a composite model (solid black line) consisting of an absorbed power law and a thermal blackbody (dotted black lines) with parameters reported in the text. Lower panel: Residuals of the two fits are shown with blue and black points, respectively. |
| In the text | |
|
Fig. 4. Lomb-Scargle periodogram of the ULTRACAM light curves (solid lines) in us (blue), gs (green), and rs (red) filters displaying the strongest peak at twice the orbital frequency (vertical dashed line). Periodograms of the residuals of the sinusoidal fits in each colour are reported with a dotted line. |
| In the text | |
|
Fig. 5. From bottom to top: Observed orbital light curves in the OM UVW1 and V filters acquired in 2021 and in the ULTRACAM us, gs, rs and is filters acquired in 2019. Ordinates are AB magnitudes. |
| In the text | |
|
Fig. 6. Panel A: ULTRACAM light curves shown with different colours fitted with the DH model and a cold spot overlaid with solid black lines. Residuals are shown in the lower panels. Panel B: Surface temperature map along the orbit. Panel C: Observed radial velocity curve of J1431 obtained by Strader et al. (2019) (black dots) and the ones predicted by the model (empty dots) connected with a solid line together with a sinusoidal fit (dotted line). Residuals are displayed in the lower panel. Here phase zero is the inferior conjunction of the companion star. |
| In the text | |
|
Fig. 7. Observed high energy X-ray and gamma-ray SED overlaid with the X-ray composite blackbody plus power law model and the superexponential cutoff model from the third Fermi-LAT pulsar catalogue (Smith et al. 2023). Dashed lines represent the single components of the X-ray model and dotted-dashed line is the extrapolation of the PLEC4 gamma-ray model. |
| In the text | |
|
Fig. 8. Left: X-ray and gamma-ray SED (black points) displayed together with the synchro-curvature model fit (solid blue line) using the three parameters described in the text. The residuals of the model with respect to the data are shown in the lower panel. Right: The same SED but fitted above 2 keV to avoid possible contamination of thermal emission from the NS. In both panels, the ordinates are expressed in erg s−1 for a distance of 3.1 kpc (left) and in erg cm−2 s−1 (right). |
| In the text | |
|
Fig. A.1. Corner plot displaying the fitted and derived parameters for the convection (C) model with post-irradiation gravity darkening (post-IGD). Contours are the 68%, 95% and 99.7% confidence levels. The plots along the diagonal are the posterior distributions of the parameters and the solid lines overlaid are the prior distrbutions. The vertical dashed lines represent the 0.025, 0.5 and 0.975 quantiles. |
| In the text | |
|
Fig. A.2. Corner plot displaying the fitted and derived parameters for the diffuse plus convection (D+C) model with post-irradiation gravity darkening (post-IGD). Contours are the 68%, 95% and 99.7% confidence levels. The plots along the diagonal are the posterior distributions of the parameters and the solid lines overlaid are the prior distrbutions. The vertical dashed lines represent the 0.025, 0.5 and 0.975 quantiles. |
| In the text | |
|
Fig. A.3. Corner plot displaying the fitted and derived parameters for the direct heating (DH) model with a cold spot and with post-irradiation gravity darkening (post-IGD). Contours are the 68%, 95% and 99.7% confidence levels. The plots along the diagonal are the posterior distributions of the parameters and the solid lines overlaid are the prior distrbutions. The vertical dashed lines represent the 0.025, 0.5 and 0.975 quantiles. |
| In the text | |
Current usage metrics show cumulative count of Article Views (full-text article views including HTML views, PDF and ePub downloads, according to the available data) and Abstracts Views on Vision4Press platform.
Data correspond to usage on the plateform after 2015. The current usage metrics is available 48-96 hours after online publication and is updated daily on week days.
Initial download of the metrics may take a while.