Open Access
Fig. 4.
Download original image
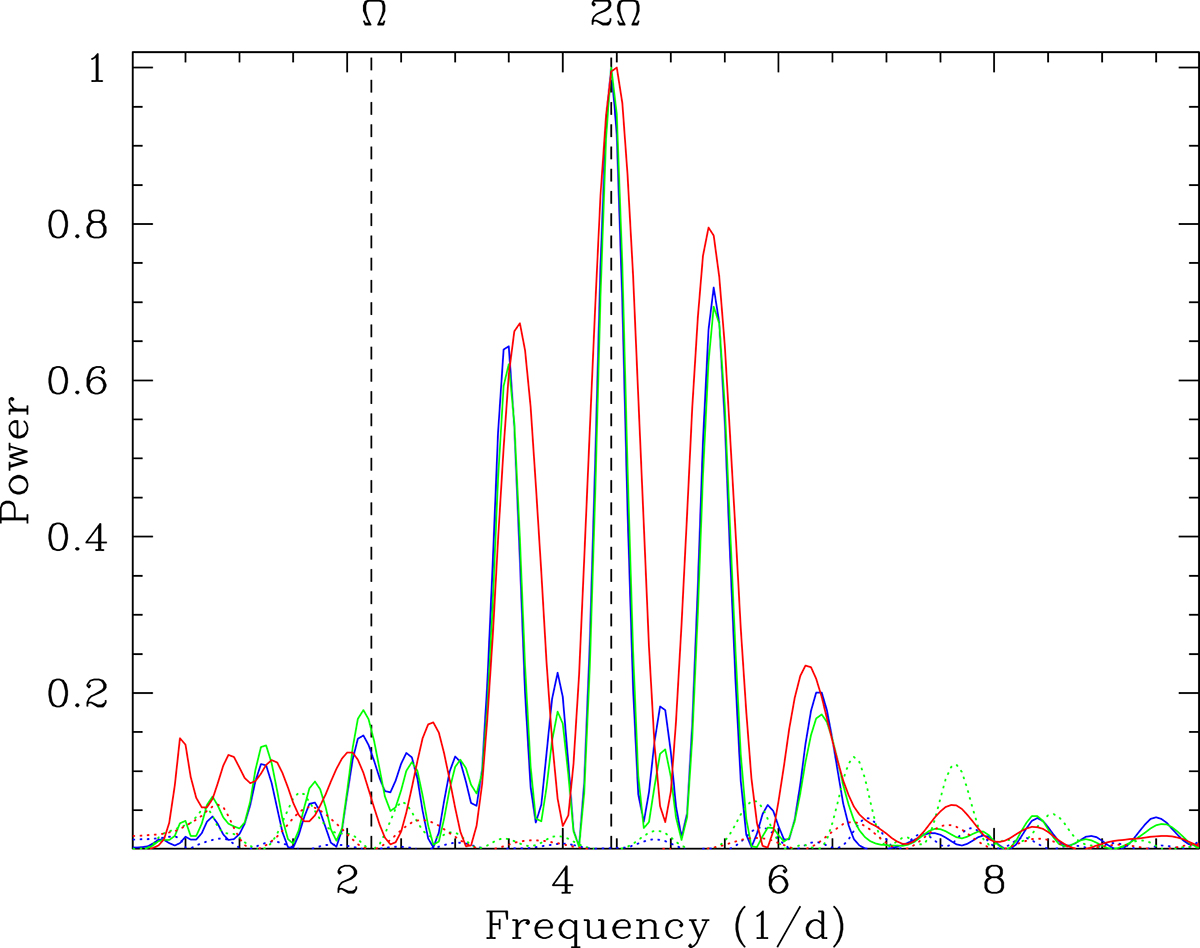
Lomb-Scargle periodogram of the ULTRACAM light curves (solid lines) in us (blue), gs (green), and rs (red) filters displaying the strongest peak at twice the orbital frequency (vertical dashed line). Periodograms of the residuals of the sinusoidal fits in each colour are reported with a dotted line.
Current usage metrics show cumulative count of Article Views (full-text article views including HTML views, PDF and ePub downloads, according to the available data) and Abstracts Views on Vision4Press platform.
Data correspond to usage on the plateform after 2015. The current usage metrics is available 48-96 hours after online publication and is updated daily on week days.
Initial download of the metrics may take a while.