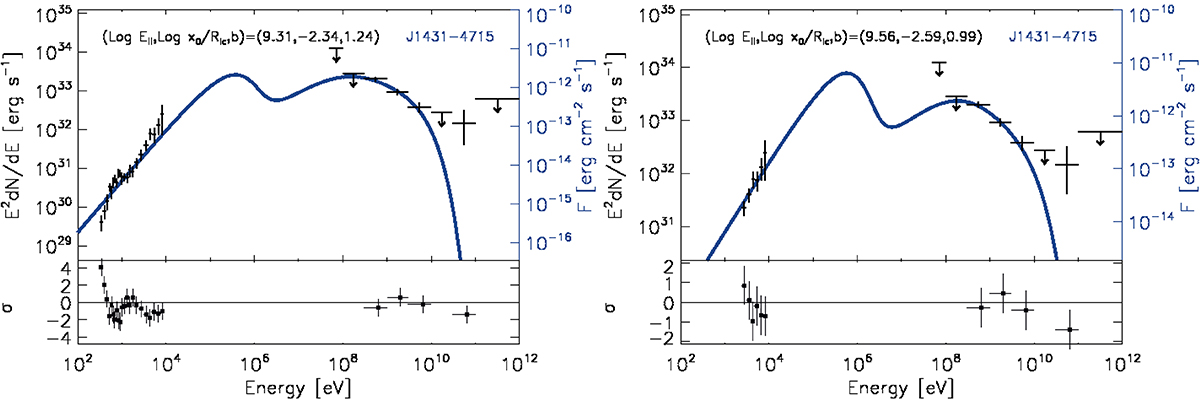
Fig. 8.
Download original image
Left: X-ray and gamma-ray SED (black points) displayed together with the synchro-curvature model fit (solid blue line) using the three parameters described in the text. The residuals of the model with respect to the data are shown in the lower panel. Right: The same SED but fitted above 2 keV to avoid possible contamination of thermal emission from the NS. In both panels, the ordinates are expressed in erg s−1 for a distance of 3.1 kpc (left) and in erg cm−2 s−1 (right).
Current usage metrics show cumulative count of Article Views (full-text article views including HTML views, PDF and ePub downloads, according to the available data) and Abstracts Views on Vision4Press platform.
Data correspond to usage on the plateform after 2015. The current usage metrics is available 48-96 hours after online publication and is updated daily on week days.
Initial download of the metrics may take a while.